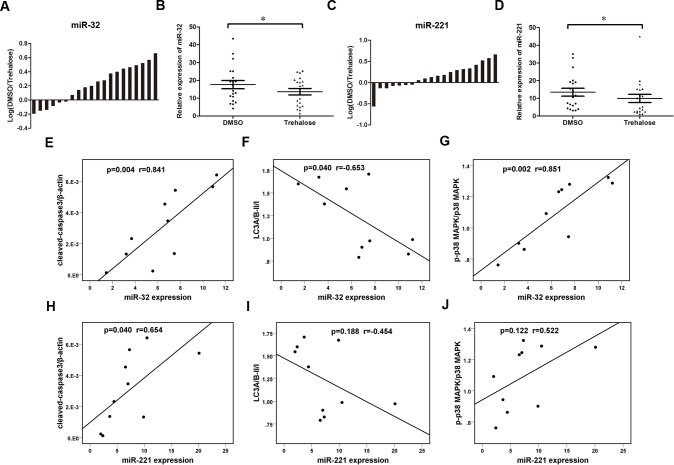
Fig 5. Expression levels of miR-32 and miR-221 in cryopreserved valve cells.
Twenty pairs of DMSO samples and trehalose samples were analyzed by qRT-PCR and normalized to U6 expression. (A and C) The bars represented relative miR-32 and miR-221 expression with the ratio of levels in DMSO samples to those in trehalose samples on a logarithmic scale. (B and D): miR-32 and miR-221 expression levels in DMSO samples and trehalose samples were compared with a paired Student’s t-test. *P < 0.05 versus DMSO group. (E, F and G): correlation analysis between miR-32 expression and cleaved caspase-3 level, LC3A/B II/I ratio and p38 MAPK phosphorylation. (H and J): correlation analysis between miR-221 expression and cleaved caspase-3 level, LC3A/B-II/I ratio and p38 MAPK phosphorylation. Spearman's analysis was used in the correlation analysis.

