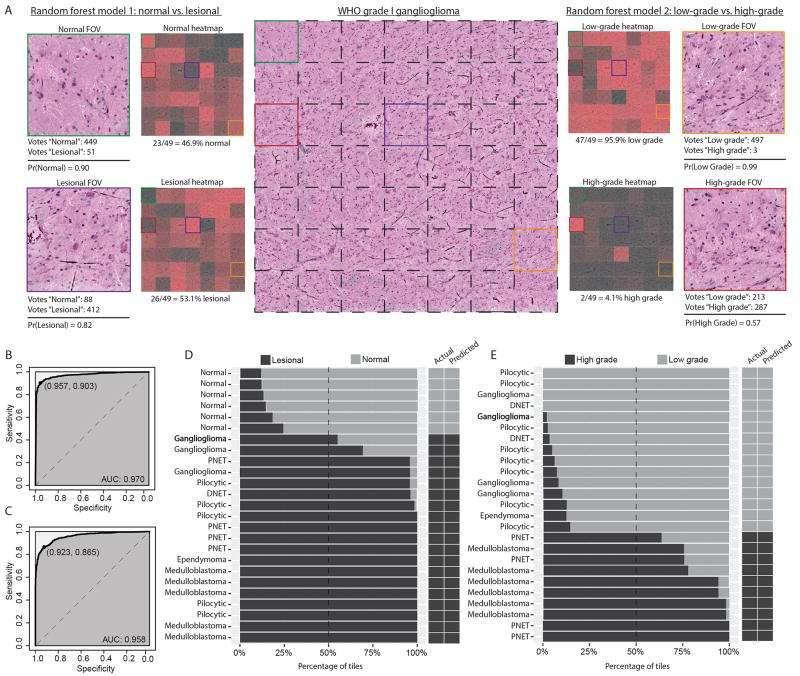
Figure 7. Validation of machine-learning model for classification of pediatric brain tumor specimens.
A) SRH image mosaic (center) of a ganglioglioma, WHO grade I, is shown with individual FOV tiles demarcated with dashed black lines. Select color-coded tiles from the image mosaic are shown peripherally to demonstrate the random forest classifier. Model 1 (left) classified the green labeled FOV as normal with 90% probability, receiving 449/500 tree votes. By contrast, purple labeled FOV was classified as lesional with 82% probability, receiving 412/500 tree votes. Normal and lesional classifier probabilities are shown for each mosaic FOV in adjacent heat map. Mosaic is correctly classified as lesional with 53.1% (i.e., modal class) of tiles voted lesional. Model 2 (right) follows similar implementation; the majority of tiles are classified as low-grade with high probability. B) ROC analysis for FOV-level performance of model 1. Optimized sensitivity and specificity are shown. C) ROC analysis for FOV-level performance of model 2. D) Model 1 mosaic-level performance shown as cumulative percentage of tiles with normal or lesional classification within each mosaic. Dashed line represents the threshold for modal diagnosis and results are shown in adjacent columns. E) Model 2 mosaic-level performance for differentiating low-grade and high-grade tumors. (DNET, dysembryoplastic neuroepithelial tumor)

