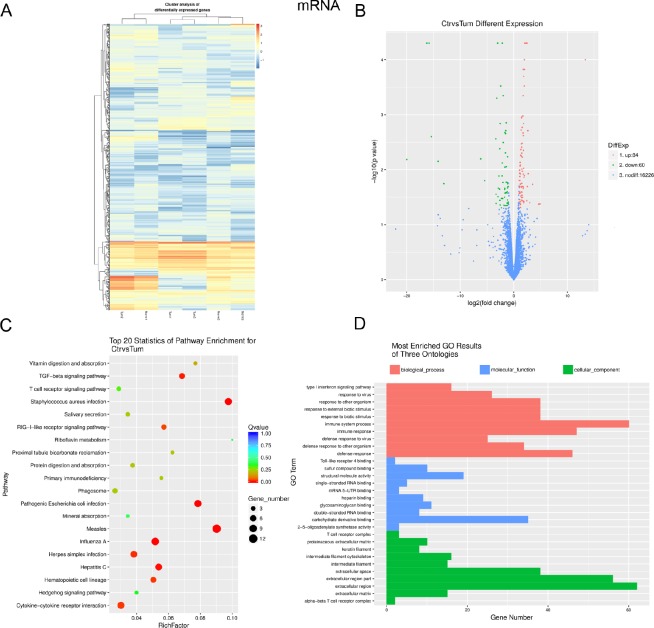
Figure 1. Expression profiles, Gene ontology (GO) terms and pathways for differentially expressed mRNAs between infantile hemangioma and adjacent normal skin tissues.
(A) Hierarchical clustering shows a distinguishable mRNA expression profiling among groups. (B) Volcano analysis exhibit differentially expressed mRNAs. Red dots represent up-regulated genes. Green dots illustrate down-regulated genes. (C) The top 20 pathways that are associated with the coding genes are listed. The enrichment Q value or false discovery rate correct the p value for multiple comparisons. P values are calculated using Fisher’s exact test. The term/pathway on the vertical axis is drawn according to the first letter of the pathway in descending order. The horizontal axis represents the enrichment factor, i.e., (the number of dysregulated genes in a pathway/the total number of dysregulated gene)/(the number of genes in a pathway in the database/the total number of genes in the database). Top 20 enriched pathways are selected according to the enrichment factor value. The selection standards were the number of genes in a pathway ≥4. The different colours from green to red represent the Q value (False discovery rate value). The different sizes of the round shapes represent the gene count number in a pathway. (D) Most enriched GO terms of the three ontologies that are associated with the differentially expressed coding genes are listed. The horizontal axis represents the gene number. The term/GO on the vertical axis is drawn according to the first letter of the GO in descending order. Red bar represents the biological process, blue bar displays the molecular function, and green bar illustrates the cellular component. Norm or Ctr, matched normal skin tissue; Tum, infantile hemangioma skin tissue.

