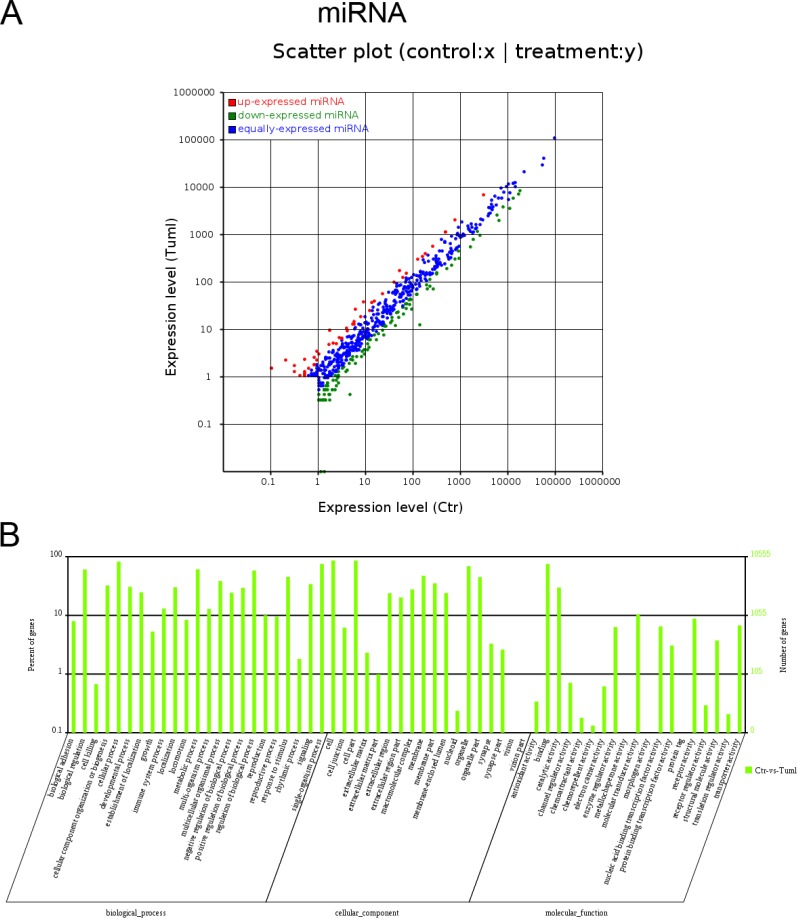
Figure 3. Expression profiles of differentially expressed miRNAs and Gene ontology (GO) terms for target mRNAs of differentially expressed miRNAs between infantile hemangioma and adjacent normal skin tissues.
(A) Scatter plot shows the differentially expressed miRNAs. Red dots represent up-regulated miRNAs. Green dots illustrate down-regulated miRNAs. (B) Most enriched GO terms of the three ontologies that are associated with the target mRNAs of differentially expressed miRNAs are listed. The term/GO on the horizontal axis is drawn according to the first letter of the GO in ascending order from left to right. The vertical axis represents the percent of genes and gene number. Ctr, matched normal skin tissue; Tum, infantile hemangioma skin tissue.

