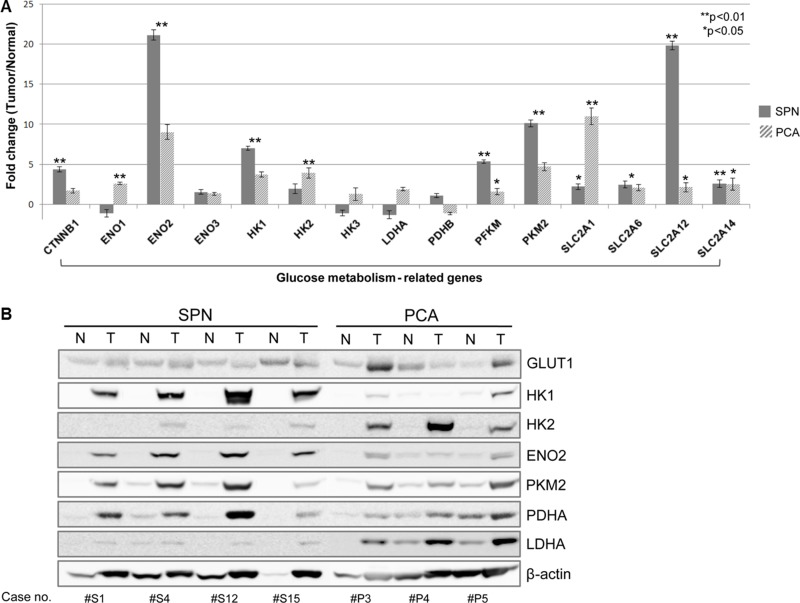
Figure 2. mRNA expression profiles and protein levels of genes for glucose metabolism in SPN.
Gene expression profiles of SPNs showed increased expression of genes involved in glucose metabolism. Note that LDHA is highly expressed in PCA comparing to normal pancreatic tissue, but it slightly decreased in SPN without statistical significance (A) See also Supplementary 2). Protein levels of HK1, ENO2, and PKM2 were overexpressed. Expression of HK1 and ENO2 were upregulated specifically in SPNs, compared to PCAs. Meanwhile, protein expression of GLUT1 was similar between SPNs and PCAs. The expressions of PDHB and LDHA in SPNs were similar to those in normal pancreatic tissue, although expression of LDHA was greater in PCAs (B). SPN, solid pseudopapillary tumor; PCA, pancreatic ductal adenocarcinoma.

