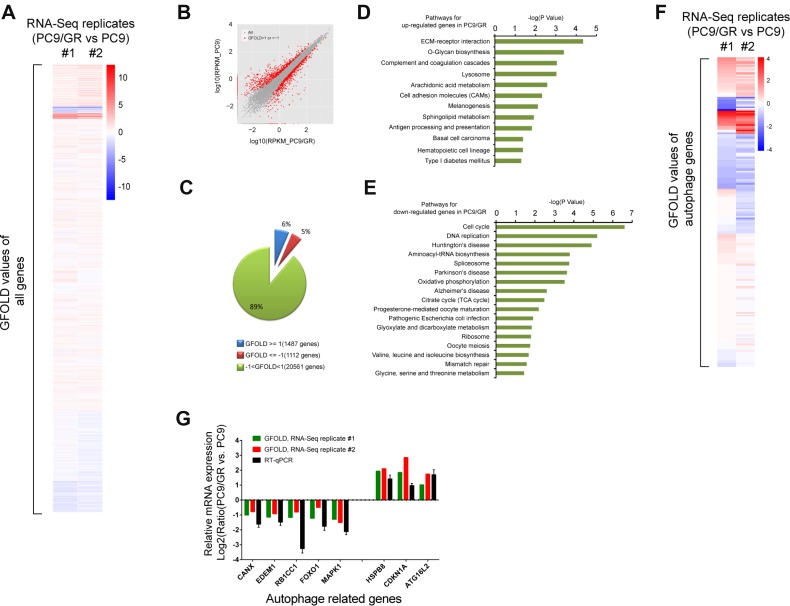
Figure 2. Transcriptome analysis of gefitinib-resistant cells.
(A) Heatmap clustering of all genes based on GFOLD values from independent mRNA-Seq replicates #1 and #2. Red: up-regulated genes in PC9/GR cells compared to those in PC9 cells. Blue: down-regulated genes in PC9/GR cells compared to those in PC9 cells. (B) Comparison of the differentially expressed genes in the PC9/GR (X axis) and PC9 cells (Y-axis), as measured by the GFOLD values. The grey dots represent all genes, the red dots represent those genes in the PC9/GR cells with GFOLD values of either >1 or <-1 compared with PC9 cells; (C) 6% of the total detected genes (1487 genes) were up-regulated (GFOLD >= 1) and 5% of the total detected genes (1112genes) were down-regulated (GFOLD <= –1) in the PC9/GR cells. The remaining 89% genes of the total detected genes have GFOLD values between -1 and 1. (D–E) KEGG pathways that were significantly enriched for the up- (D) or down-regulated (E) genes in PC9/GR cells compared with the PC9 cells using DAVID analysis (P <= 0.05). (F) Heatmap clustering of autophagy-related genes based on GFOLD values. Blue: down-regulated genes in PC9/GR cells compared to those in PC9 cells. (G) Correlation of mRNA expression from mRNA-Seq and RT-qPCR for selected autophagy genes. Y axis represents the Log2 transformed mRNA expression levels from three experiments: mRNA-Seq replicate #1 and #2, and RT-qPCR.

