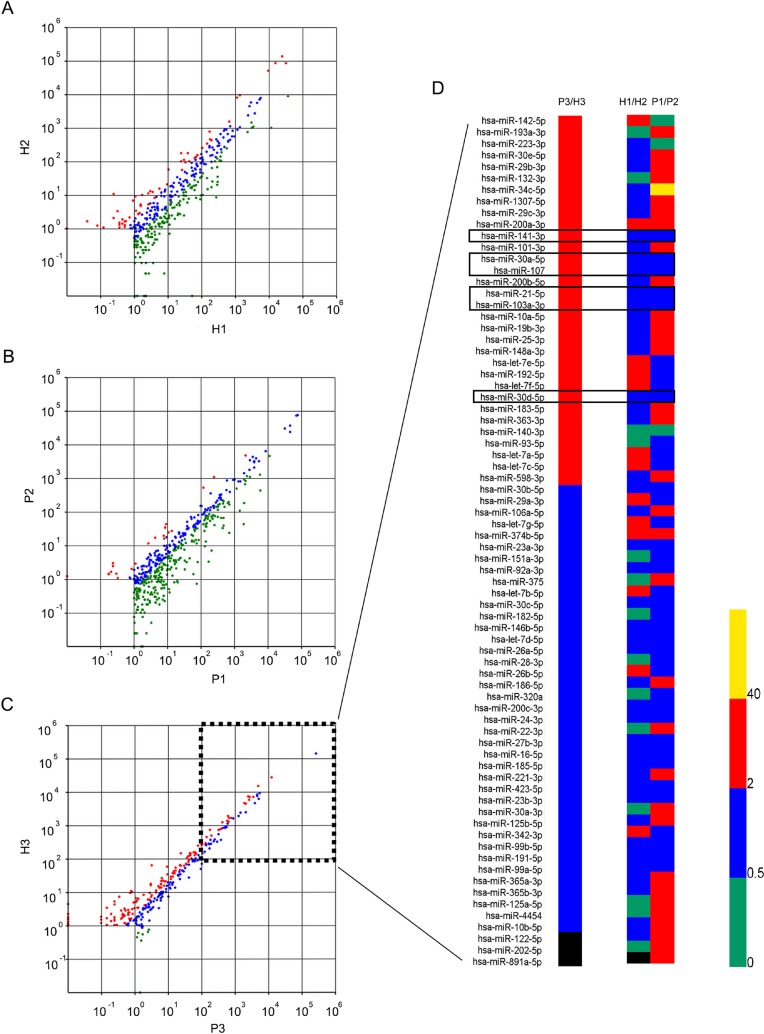
Figure 3. Scatter plot graph and heat map for EPS-miRNAs according to their normalized counts of high-throughput sequencing.
Every EPS-miRNA was showed with different color according to the ratio of normalized counts between two subgroups. Red (up-regulated), green (down-regulated), blue (equaled), and black (undetected). (A) Differential expression profile of normal EPS-miRNAs in bio-duplication subgroups (H1 and H2). 77 (H1) and 83 (H2) miRNAs were detected with normalized counts > 100. 66 EPS-miRNAs were simultaneously identified with normalized counts >100 in both healthy subgroups, and these miRNAs were considered as abundant EPS-miRNAs in healthy men. (B) Differential expression profile of EPS-miRNAs of IIIA CP/CPPS patients in bio-duplication subgroups (P1 and P2). 106 (P1) and 71 (P2) miRNAs were detected with normalized counts >100. 70 abundant EPS-miRNAs were identified in IIIA CP/CPPS patients. (C) Differentially expression profile of dysregulated EPS-miRNAs in P3 and H3 subgroups. Changed fold ranged from 0 to 2 was considered as being equally expressed (blue plot). In total, 22 abundant EPS-miRNAs (normalization counts >100) was up-regulated with change-fold >2 (red plots). (D) Change-folds of all abundant EPS-miRNAs from P3/H3, H1/H2, and P1/P2 subgroups. Results indicated 22 abundant EPS-miRNAs were up-regulated in P3 subgroup compared to H3 subgroup with more than 2 folds. Meanwhile, miR-21-5p, miR-30a-5p, miR-30d-5p, miR-103a-3p, miR-107, and mir-141-3p were stably expressed not only in the patient group but also in the health group.

