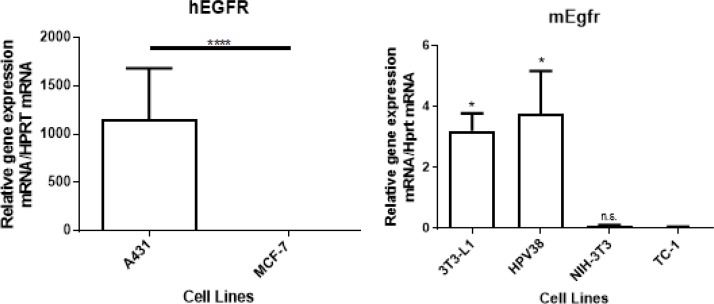
Figure 1. EGFR mRNA expression in vitro in 2 human cell lines (A431 and MCF-7) and 4 murine cell lines (3T3-L1, HPV38, NIH-3T3, and TC-1).
(A) A431 expressed more than 1 thousand-fold EGFR compared to MCF-7 cells. (B) 3T3-L1 and HPV38 expressed detectable levels of Egfr. NIH-3T3 and TC-1 did not express detectable levels of Egfr. The p-value was determined using (A) unpaired student’s t-test or (B) one-way ANOVA analysis, followed by a post-hoc Tukey’s multiple comparisons test (data compared with TC-1), n = 3 (*p < 0.05, ****p < 0.0001, n.s: not significant). Data shown is representative of one experiment of three with similar results.

