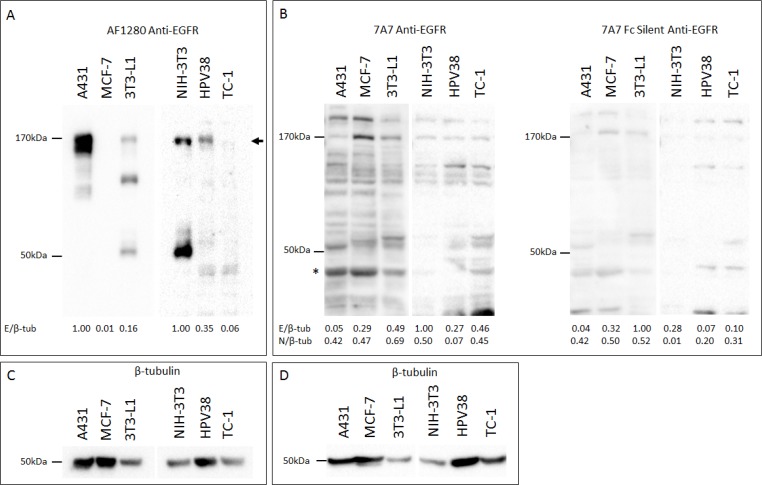
Figure 2. 7A7 and 7A7 Fc Silent do not detect EGFR expression by Western blot.
Protein was extracted from A431, MCF-7, 3T3-L1, NIH-3T3, HPV38, and TC-1 cells, and immunoblotted for EGFR (A–B) and β-tubulin (C–D). (A) AF1280; (B) 7A7 and 7A7 Fc Silent; (C) and (D) β-tubulin internal loading controls for (A) and (B) respectively. EGFR was detected as a ∼ 170kDa band by AF1280 (as shown by arrow). Numbers at the bottom of each lane in (A) and (B) represent quantification of each lane normalised to corresponding β-tubulin measurements and relative to the highest resulting ratio on the respective blots. * = position of non-specific band used as a comparator for EGFR-specificity. E/β-tub; EGFR/β-tubulin, N/β-tub; non-specific band/β-tubulin.

