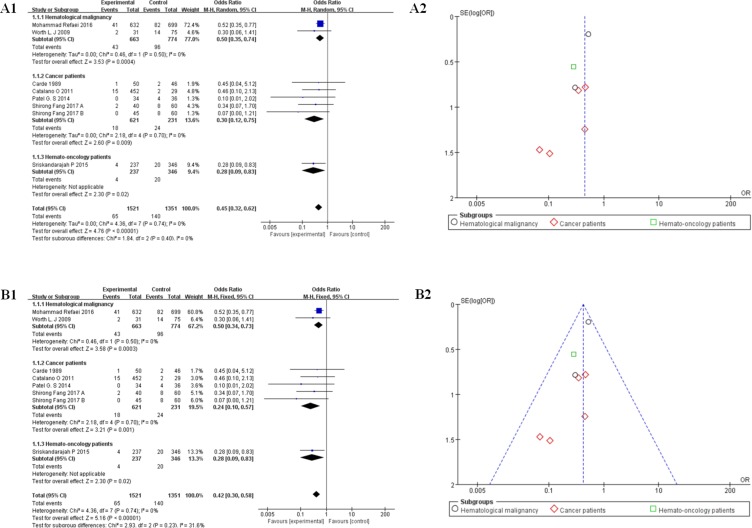
Figure 3.
(A) Forest plot (A11,RE) and funnel plot (A2,RE) showing risk of venous thromboembolism between peripherally inserted central catheters (PICCs) and central inserted central catheters (CICCs) group. Forest plot showing odds ratio (OR) of development of upper-extremity DVT in patients with peripherally inserted central catheters versus central venous catheters. (B) Forest plot (B1, FE) and funnel plot (B2, FE) showing risk of venous thromboembolism between peripherally inserted central catheters (PICCs) and central inserted central catheters (CICCs) group. Forest plot showing odds ratio (OR) of development of upper-extremity DVT in patients with peripherally inserted central catheters versus central venous catheters. PICC = peripherally inserted central catheter; CICC = central inserted central catheter; FE = fixed effect; RE= random effect; OR = odds ratio; RR = risk ratio; VTE = venous thromboembolism.

