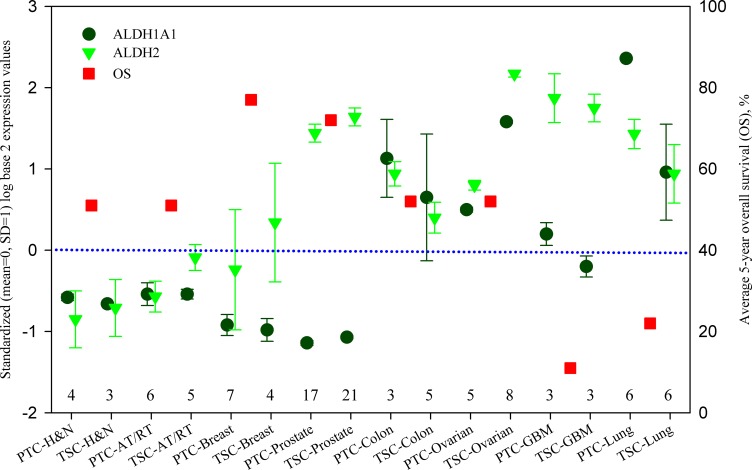
Figure 1. ALDH1A1 and ALDH2 expression of parental tumor cells and tumor stem-like cells, and 5-year overall survival in different cancers.
ALDH1A1 and ALDH2 are presented by standardized (mean = 0, SD = 1) log base 2 expression values at the left axis. The data were calculated from the Series GSE19713, GSE23806, GSE28799, GSE35603 and GSE67966, and their sample numbers are listed above the x-axis. Average 5-year overall survival (OS) data are obtained from the literatures listed in Supplementary Table 1 and presented at the right axis. PTC: parental tumor cell, TSC: tumor stem-like cell, AT/RT: Atypical teratoid/rhabdoid tumour, GBM: glioblastoma, H & N: head and neck.

