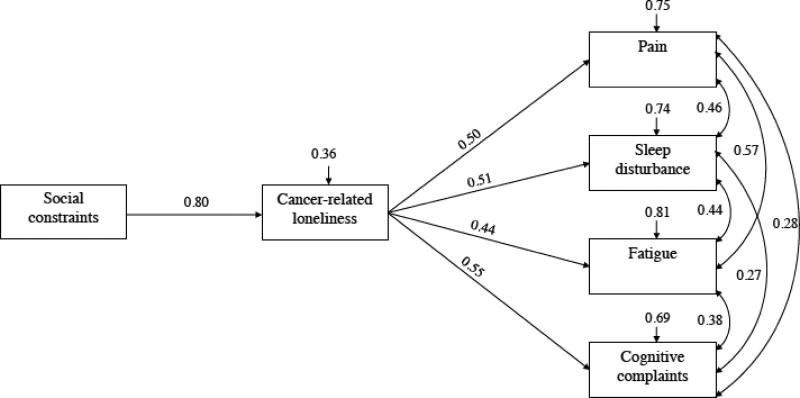
Figure 1. Relationships between Social Constraints, Cancer-related Loneliness, and Patient Symptoms.
Note. All pathways and covariances are significant with p < 0.05. χ2 (4, N = 182) = 9.96, Bootstrap p = 0.229, RMSEA = 0.090 (90% CI: 0.017, 0.163), SRMR = 0.034, CFI = 0.990. The arrows above the boxes are disturbance terms, denoting the amount of unexplained variance. For example, 0.36 above cancer-related loneliness indicates that 36% of the variance in this variable is unexplained by the current model.

