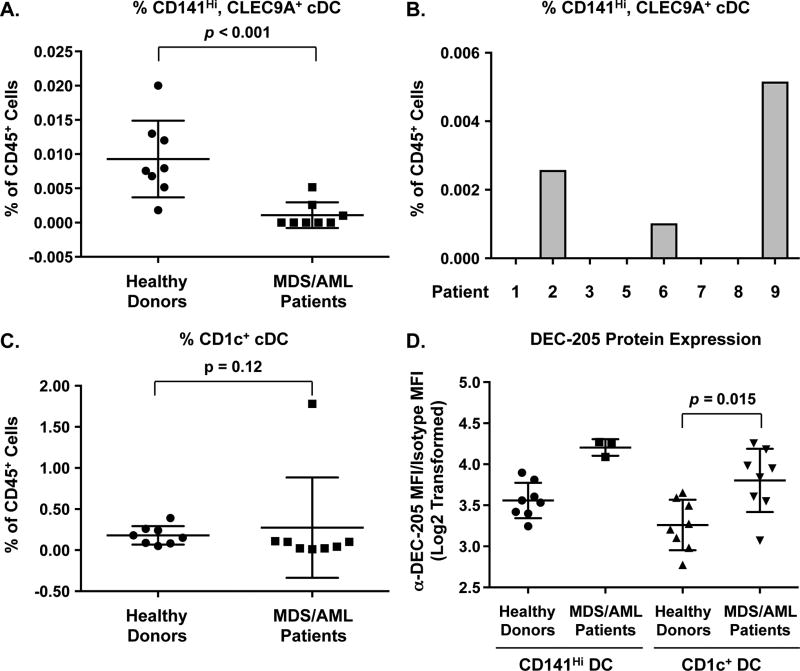
Figure 3. Frequency of CD141Hi and CD1c+ cDCs in vaccinated MDS/AML patients.
Flow cytometry analysis was performed on peripheral blood samples isolated from the MDS/AML patients (enrolled on study) pre-treatment and from healthy age matched donors. A. Average frequency of CD141Hi, CLEC9A+ cDCs within the CD45+ population. N = 8 for healthy donors (circles) and MDS patients (squares). Data are presented as values for individual patients. The horizontal bar represents the mean value and error bars represent standard error of the mean. P values were determined using the Mann Whitney U test. B. Frequencies of CD141Hi, CLEC9A+ cDCs in CD45+ peripheral blood cells in individual MDS patients on study pre-treatment. C. Average frequency of CD1c+ cDCs within the CD45+ population. D. Average median fluorescent intensity (MFI) of anti-DEC-205 staining of CD141Hi (left) and CD1c+ (right) cDCs in healthy controls and MDS/AML patients on study. For all samples, anti-DEC-205 MFI was normalized to isotype control and Log2 transformed. Data are presented as values for individual patients. The horizontal bar represents the mean value and error bars represent standard error of the mean.

