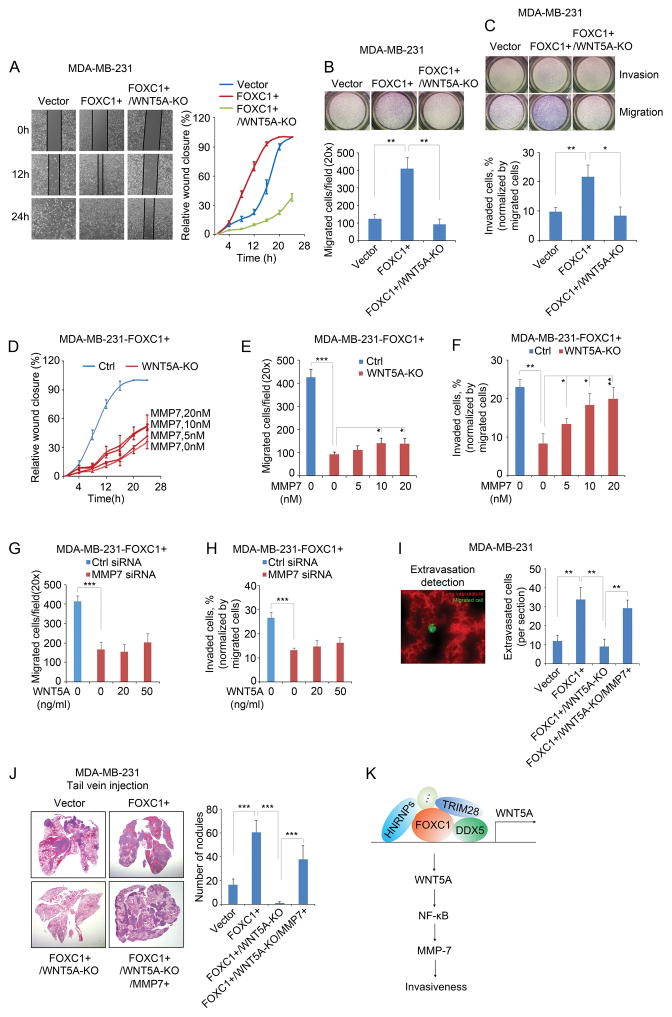
Figure 4.
WNT5A mediates the FOXC1-induced invasiveness of TNBC cells. A, wound healing assays at different time points in different groups of MDA-MB-231 cells. Cells were seeded into a 12-well plate and allowed to grow to 90% confluence. The surface of each well was scratched by using a 1ml pipette tip. Cells were washed twice with culture medium to remove the detached cells. Pictures were taken at different time points and the gap distance was measured using ImageJ software. B and C, migration (B) and invasion (C) assays in different groups of MDA-MB-231 cells. 1×10⁵ cells were re-suspended in 500μl serum-free medium and seeded into the upper compartment of Transwell chamber (Corning) or Matrigel invasion chamber (BD Biosciences) for migration or invasion assay, respectively. The lower compartment of the chamber was filled with 750 μl complete medium. After 4 hours (migration) or 8 hours (invasion) of incubation, cells left in the upper compartment were removed with a cotton swab, and the migrated or invaded cells were stained by using HEMA3 staining kit (Fisher Scientific). Pictures were taken and the cells were counted using ImageJ software. The bar graph indicates mean ± SD, n = 3. ***, p < 0.001. D, E, and F, FOXC1-overexpressing WNT5A-KO MDA-MB-231 cells were treated with different concentrations of recombinant MMP7 protein (Aviva Systems Biology) in wound healing assays (D), migration assay (E), and invasion assay (F). The bar graph indicates mean ± SD, n = 3. *, p < 0.05, **, p < 0.01, ***, p < 0.001. G and H, FOXC1-overexpressing MMP7-knockdown MDA-MB-231 cells were treated with different concentrations of recombinant WNT5A protein in migration assays (G) and invasion assays (H). The bar graph indicates mean ± SD, n = 3. ***, p < 0.001. I, extravasation assays of different groups of cells injected through the tail vein, and images were taken 48h after injection. To establish FOXC1- and MMP7-overexpressing and WNT5A-knockout (FOXC1+/WNT5A-KO/MMP7+) cells, FOXC1+/WNT5A-KO cells were transfected with the pCMV6-MMP7 plasmid. pCMV6-MMP7 was constructed by cloning the MMP7 ORF into a pCMV6 vector. Representative image shows the migrated cancer cells and the lung vasculature (left panel, 40×). All the migrated cells were counted from each frozen section, and three mice were used for each group. No randomization or blinding was used. All animal experiments were performed in accordance with the approval of the Cedars-Sinai Medical Center Institutional Animal Care and Use Committee. Cells were labeled with 5μM CellTracker Green CMFDA (C2925, ThermoFisher Scientific) for 45 minutes. 1×10⁵ cells/100μl PBS were injected into nude mice (Charles River Laboratories) through the tail vein. Forty-eight hours after injection, mice were injected with 50μg rhodamine-lectin (RL-1102, Vector Laboratories) in 100μl PBS through the tail vein and sacrificed in 30 minutes. Mouse lung tissues were collected and frozen in liquid nitrogen, then were embedded in OCT compound (Tissue-Tek). Frozen sections were cut and examined under fluorescence microscope. The bar graph indicates mean ± SD. **, p < 0.01. J, in vivo assay to assess the invasive capacity of different groups of cells injected through the tail vein. To establish FOXC1- and MMP7-overexpressing and WNT5A-knockout (FOXC1+/WNT5A-KO/MMP7+) cells, FOXC1+/WNT5A-KO cells were transfected with pEGFP-C3-MMP7. pEGFP-C3 empty vector was provided by Sandra Orsulic (Cedars-Sinai Medical Center). pEGFP-C3-MMP7 was constructed by cloning MMP7 ORF into the pEGFP-C3 vector. EGFP-labeled cells were sorted by FACS (Aria III). 5×10⁵ cells were suspended in 100μl PBS and injected into nude mice through the tail vein. Mice were sacrificed two weeks after injection. Mouse lungs were collected and metastasis nodules were counted. Then the lungs were fixed in 4% formalin and sections were cut, followed by haematoxylin-eosin staining. Four mice were used for each group. No randomization or blinding was used. The bar graph indicates mean ± SD. ***, p < 0.001. K, schematic diagram of the involvement of FOXC1-WNT5A-NF-κB-MMP7 signaling in TNBC cell invasion.

