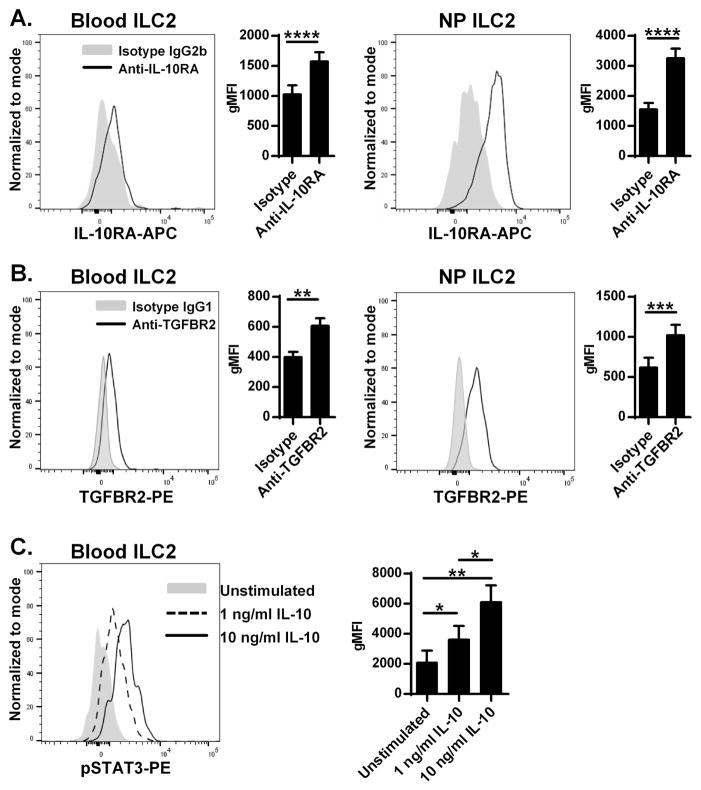
Figure 1. Presence of receptors for IL-10 and TGF-β on human ILC2.
Representative histograms of flow cytometric plots for IL-10RA (A) and TGFBR2 (B) in ILC2s from a blood sample and a NP are shown. Levels of cell surface expression of receptors on ILC2s from blood (n=10) and NPs (n=10) are shown by geometric mean fluorescence intensity (gMFI). PBMC were stimulated with medium control (filled), 1 (dashed line) or 10 (solid) ng/ml IL-10 for 15 minutes. The level of intracellular phospho-STAT3 in blood ILC2s was detected by flow cytometry (C, n=6). * p<0.05, ** p<0.01, **** p<0.0001, by the Paired t test (A and B) and one-way ANOVA (C).

