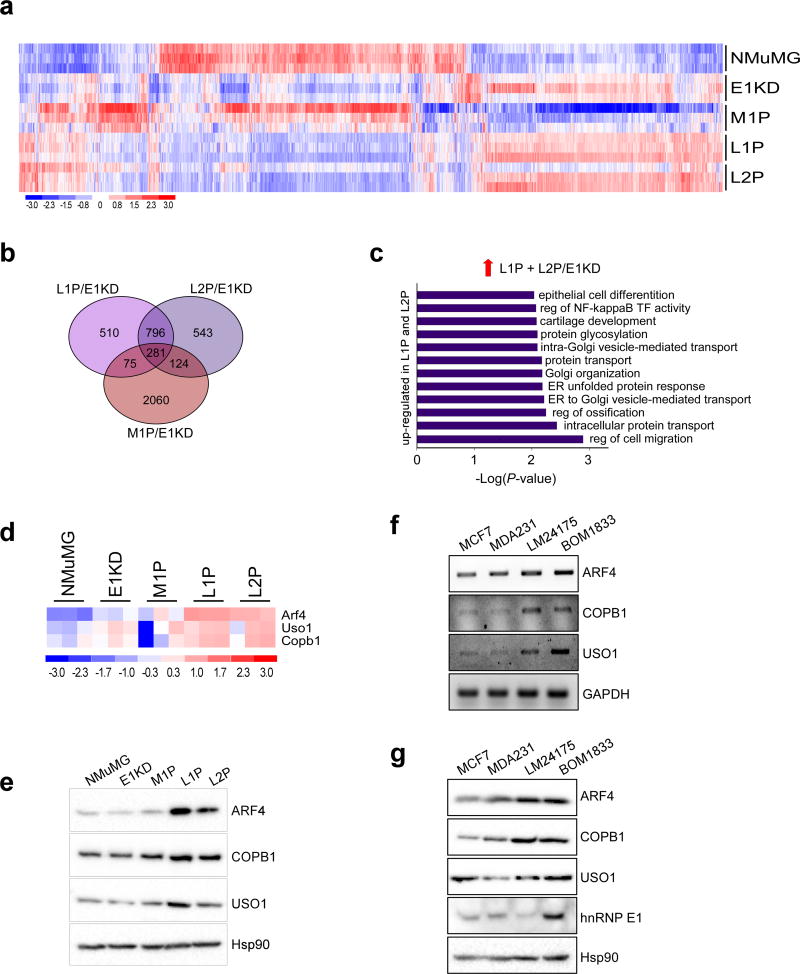
Figure 2. Identification of a metastasis-associated gene signature through the in vivo selection of mammary epithelial cells.
(a) Heat-map of differentially regulated genes in triplicate samples generated using dChip software; data was filtered using a P-value of 0.05 and a 1.5 fold cut off. (b) Venn diagram showing overlap between M1P/E1KD, L1P/E1KD and L2P/E1KD data sets. (c) Graph of enriched GO processes in up-regulated genes unique to L1P and L2P cells, filtered using a P-value of 0.01. (d) Heat-map of ARF4, COPB1 and USO1 trafficking genes up-regulated in L1P and L2P cells compared to E1KD cells. (e) Immunoblot analysis of ARF4, COPB1 and USO1 levels in the NMuMG progression series. Hsp90 was used as a loading control. (f) Transcript levels of ARF4, COPB1, USO1 and GAPDH in MCF-7, MDA-231, LM2-4175 and BOM-1833 cells. (g) Protein levels of ARF4, COPB1, USO1 and hnRNP E1 in MCF-7, MDA-231, LM2-4175 and BOM-1833 cells. Hsp90 was used as a loading control.

