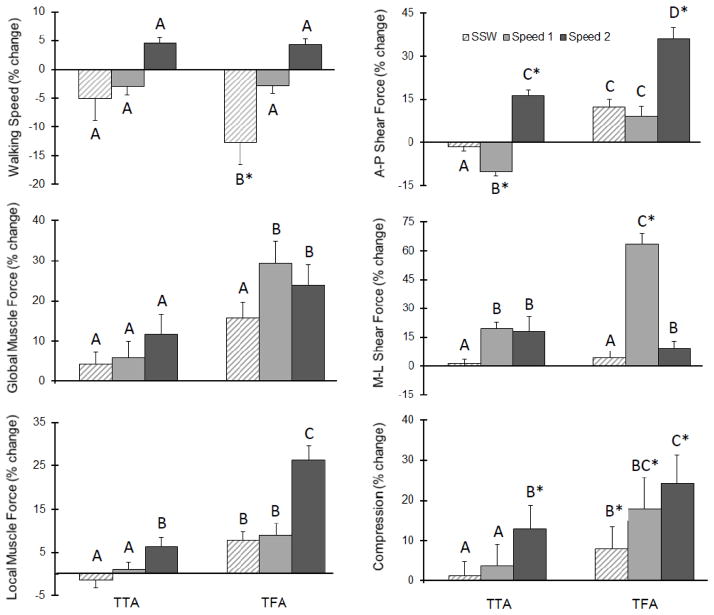
Figure 1.
Mean (standard deviation) percent change in each outcome for both the transtibial (TTA) and transfemoral (TFA) groups with respect to controls at self-selected (SSW) and controlled speeds (“Speed 1” = 1.0 m/s and “Speed 2” = 1.4 m/s). Letters indicate post hoc comparisons and asterisks indicate significant differences relative to controls.

