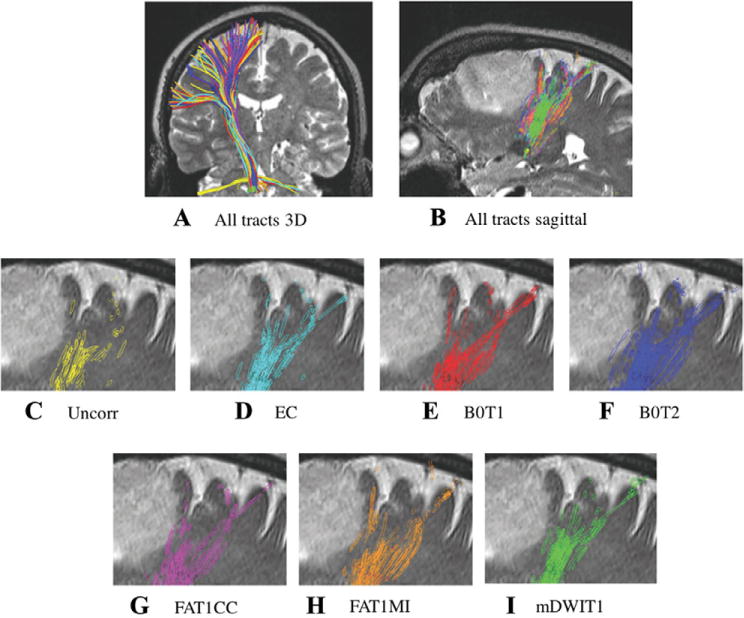
Fig 4.

Spatial relationship of the tracts to the tumor.
Spatial relationship of the tracts with the tumor: the distance from the tracts to the lesion can vary with the registration method. (A) 3D representation of tractography results in corticospinal tract from patient 9 with diffuse astrocytoma. After application of registration pipelines, the location of the seeded tracts appears visually similar in 3D. (B) Tracts from all pipelines, showing their intersection with a T2 sagittal slice. (C-I) Tracts’ intersection with a T2-weighted anatomical image shows the variability across pipelines. EC = Eddy current and movement corrected data; Uncorr = uncorrected data; B0T1 = baseline to T1-weighted anatomical image (T1) registration pipeline; B0T2 = baseline to T2-weighted anatomical image (T2) registration pipeline; FAT1CC = fractional anisotropy to T1 registration pipeline; FAT1MI = fractional anisotropy to T1 registration pipeline; mDWIT1 = mean diffusion-weighted image to T1 registration pipeline.
