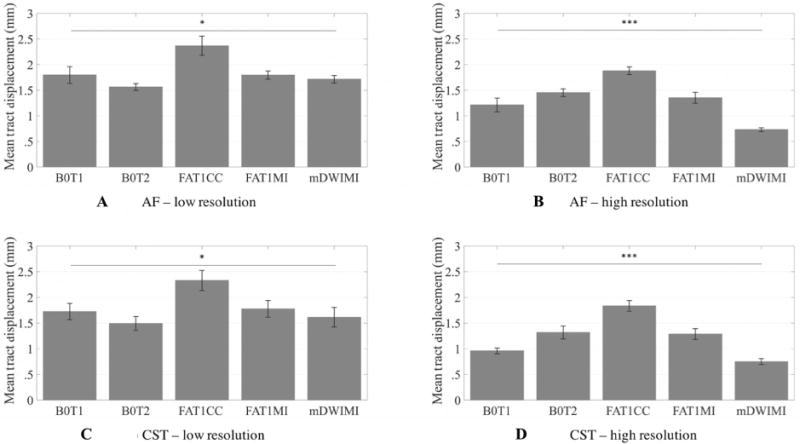
Fig 5.

Estimated mean tract displacement.
Comparison across registration pipelines shows significant differences in estimated displacement of critical white matter structures. Mean absolute displacement of arcuate fasciculus (low-resolution (A) and high-resolution (B) data) and corticospinal tract (low-resolution (C) and high-resolution (D) data), after averaging over hemisphere. Statistics were performed on mean displacement values (in mm) on N= 6 subjects for arcuate fasciculus (AF) and on N= 9 subjects for corticospinal tract (CST) using a one-way ANOVA (low-resolution data: AF, P= .012; CST, P= .014), * = P < .05; (high-resolution data: AF, P < .001; CST, P < .001), *** = P < .001. Significant comparisons are indicated by asterisks (*P < .05, **P < .001, ***P < .0001). B0T1 = baseline to T1-weighted anatomical image (T1) registration pipeline; B0T2 = baseline to T2-weighted anatomical image (T2) registration pipeline; FAT1CC = fractional anisotropy to T1 registration pipeline; FAT1MI = fractional anisotropy to T1 registration pipeline; mDWIT1 = mean diffusion-weighted image to T1 registration pipeline.
