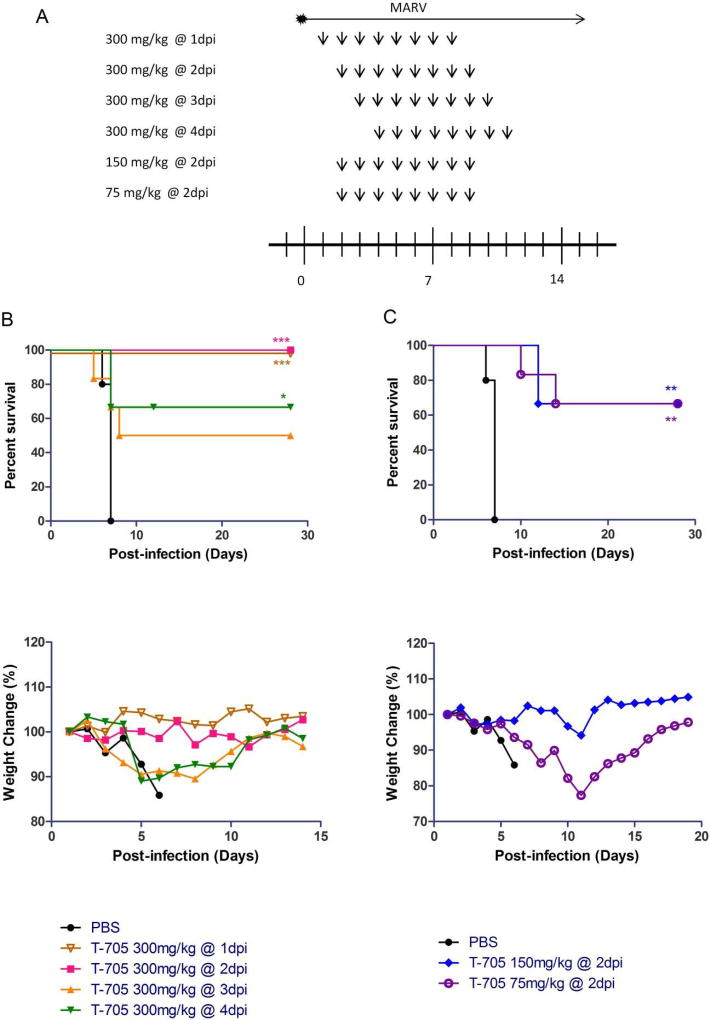
Fig. 2. Survival rate and relative weight change in MARV-infected mice.
(A) Six mice in each group were inoculated via the intraperitoneal route with mouse-adapted MARV. Mice were treated orally once daily with 300 mg/kg/day T-705 beginning on day 1, 2, 3, or 4 post-infection, or with 150 or 75 mg/kg/day T-705 beginning on day 2 post-infection and continuing for eight consecutive days. Control mice were treated on the same schedule with an equal volume of PBS. All mice were monitored daily for survival and weight loss. (B, C) Kaplan-Meier survival curves and relative body weight changes in MARV-infected mice treated with 300 mg/kg/day of T-705 beginning on day 1, 2, 3, or 4 post-infection (B) or treated with 150 mg/kg/day or 75 mg/kg/day of T-705 beginning on day 2 post-infection (C). Relative weight changes are depicted as the mean of six mice. Statistical comparisons between PBS-treated and T-705-treated animals were performed using the Mantel-Cox (log-rank) test: ***, P<0.001; **, P < 0.01; *, P < 0.05.

