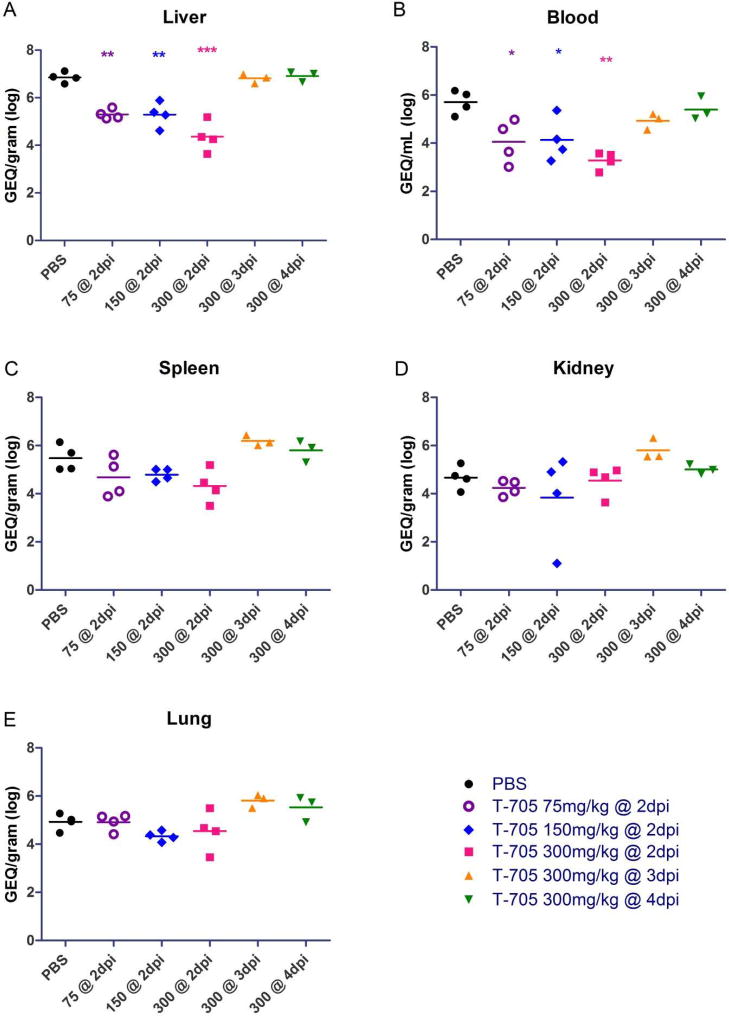
Fig. 3. Virus RNA replication in mouse blood and tissues.
(A-E) MARV genome equivalent (GEQ) RNA levels in liver (A), blood (B), spleen (C), kidney (D), and lung (E) samples collected at day 6 post-infection were determined by RT-qPCR for uninfected mice or mice treated with PBS (control), 300 mg/kg/day T-705 beginning on day 2, 3 or 4 post-infection, 150 mg/kg/day T-705 beginning on day 2 post-infection, or 75 mg/kg/day T-705 beginning on day 2 post-infection. Statistical comparisons between PBS-treated and T-705-treated animals were performed using a one-way ANOVA test with Bonferroni’s multiple-comparison correction: ***, P<0.001; **, P < 0.01; *, P < 0.05.

