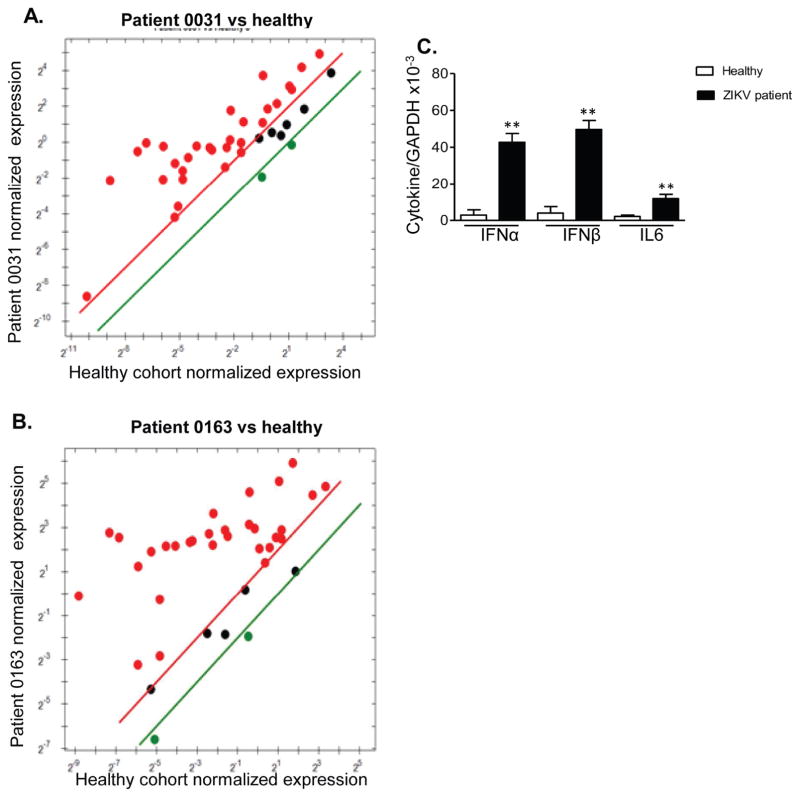
Figure 3. Antiviral cytokine production in ZIKV patients.
A–B. PrimePCR array. The scatter plot shows the normalized expression of targets for two ZIKV patients versus matched healthy controls. The plot image shows the following changes in target expression based on the threshold set of 2: upregulation as red circles, downregulation as green circles; and no change as black circles. C. Cytokine production was determined by Q-PCR. n = 5. ** P < 0.01 or *P < 0.05 compared to healthy cohorts.

