Fig. 3.
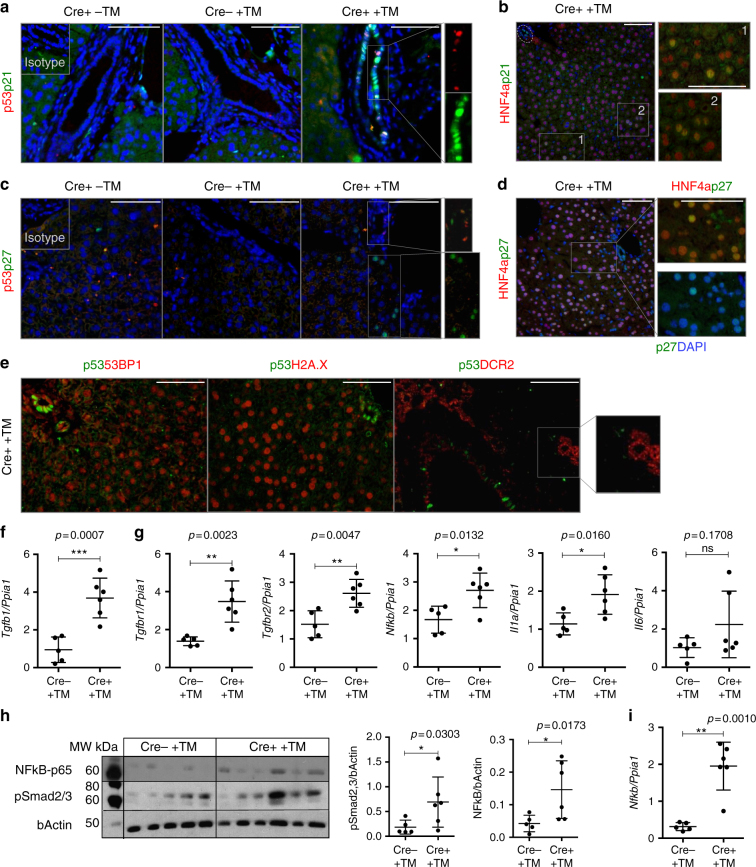
Paracrine senescence in the model is TGFβ-dependent. Mouse data is presented at day 2 after final tamoxifen administration (N = 6 per group). (Left) K19Cre-positive mice without tamoxifen injection. (Center) K19Cre-negative mice after tamoxifen injection. (Right) K19Cre-positive mice after tamoxifen injection. a p53 (red, indicative of primary senescence events in the cholangiocytes) and p21 (green) co-localize in the bile ducts. However, p21-positive p53-negative cholangiocytes were observed. b p21 (green) co-localizes with HNF4α-positive hepatocytes (red). c p27 (green) colocalizes with p53-positive cholangiocytes (red). p27 is expressed in cholangiocytes and hepatocytes in a paracrine manner. d p27 (green) co-localizes with HNF4α-positive hepatocytes (red). e Markers of senescence (such as 53BP1, H2A.X and DCR2, in red) are expressed in cholangiocytes and liver parenchyma, while expression of p53 (green) is restricted to the cholangiocytes. Single channels for this figure are provided in Supplementary Fig. 8a. Scale bars = 50 µm. f qRT-PCR analysis of Tgfb1 in the isolated bile ducts of Cre− +TM (N = 5) and induced Cre+ +TM (N = 6) K19-Mdm2flox/floxtdTomLSL mice day 2 after induction. *** denotes p < 0.005 (Mean ± SEM). Mann−Whitney test. g Analysis of common SASP’s factors by qRT-PCR (from left to right, Tgfbr1, Tgfbr2, Nfkb, Il1a and Il6). * denotes p < 0.05, ** p < 0.01 (Mean ± SEM). Mann−Whitney test. h Western blot of phospho-NF-κB-p65 and pSmad2/3. Each band represents the bile ducts isolated from one mouse. Blots are companied by at least one marker position (molecular weights MW, in kDa). Far right, western blot densitometry quantification (normalized to bActin control) show increased expression of NF-κBp-65 and pSmad2/3 after induction of the model. * denotes p < 0.05 (Mean ± SEM). Mann−Whitney test. i qRT-PCR of Nfkb in hepatocytes isolated from Cre− and Cre+ K19-Mdm2flox/floxtdTomLSL mice at day 2 after last tamoxifen administration (N = 5-6 per group). ** denotes p < 0.01 (Mean ± SEM). Mann−Whitney test

