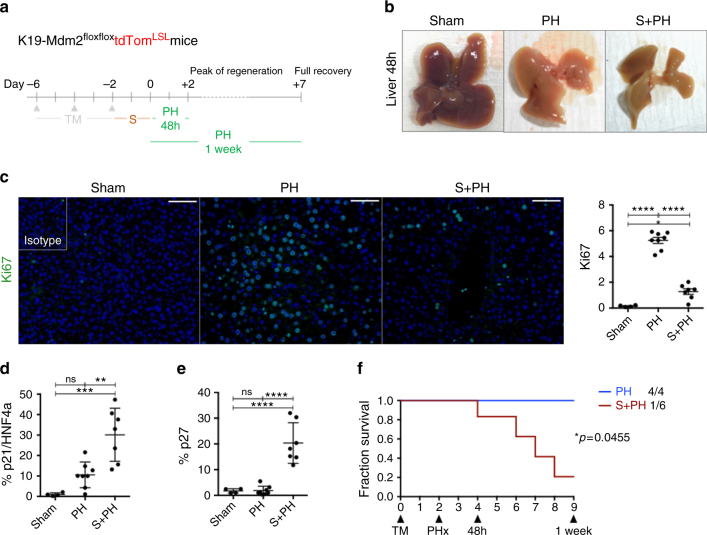
Fig. 5.
Cellular senescence in cholangiocytes impairs the regenerative response of liver parenchyma. a Schematic representation of the experiment. After induction of the model, we waited 2 days for display of senescence and performed 70% PH. Livers were recovered at day 2 after the surgery (peak of DNA replication in hepatocytes) and day 7 (when the liver mass is restored). Two groups were included in this experiment; PH (N = 8) and Senescence + PH (S + PH, N = 7). Sham animals are included as controls of the PH technique (N = 4). b Whole livers collected at 48 h post PH. From left to right: Sham (no manipulation of the liver), PH (which shows normal regenerative process by compensatory hypertrophy) and S + PH. Notice the absence of compensatory hypertrophy in the S + PH liver. c Decrease of Ki67 (green) in the S + PH group in comparison with PH group and Sham at 48 h post PH. Far right, quantification of total proliferation in the liver. *p < 0.05, ****p < 0.0001, (Mean ± SEM). ANOVA, Sidak’s multiple comparisons test. Scale bars = 50 µm. d Increase of p21-positive hepatocytes in S + PH group at 48 h post-PH. **p < 0.01, ***p < 0.001 (Mean ± SEM). ANOVA, Sidak’s multiple comparisons test. e Increase of total p27 in S + PH group at 48 h post-PH. ****p < 0.0001 (Mean ± SEM). ANOVA, Sidak’s multiple comparisons test. f Survival curve for PH vs. S + PH at 1 week show a significant decrease of survival for S + PH mice (PH, N = 4; S + PH, N = 6). Log-Rank (Mantel−Cox test)

