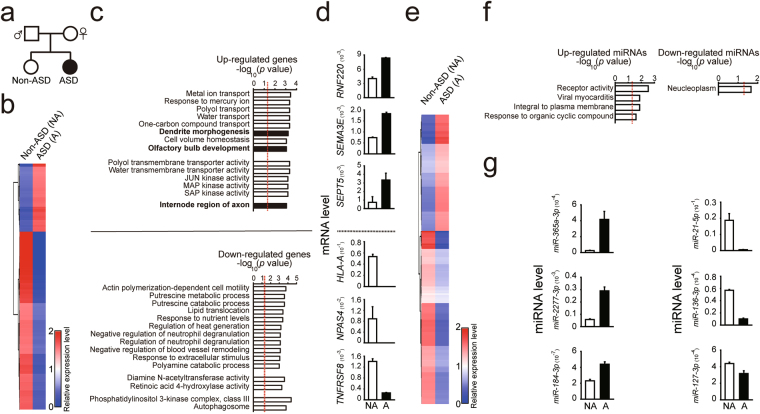
Figure 1.
Differential gene and miRNA expression patterns in the postmortem prefrontal cortex (PFC) of a person without and with ASD. (a) Schematic diagram of the family tree from a family quartet with ASD. Square indicates male and circle indicates female. Black solid circle indicates the offspring with ASD; open circle indicates the offspring without ASD. (b) Heatmap analyses showing gene expression profiles for the offspring without and with ASD. (c) Gene ontology (GO) enrichment analysis was performed for affected genes from the offspring with ASD. (d) The top genes that were up-regulated (top) and down-regulated (bottom) were validated by qPCR; expression levels of genes for the offspring with ASD (black bars) compared with levels for the offspring without ASD (open bars). (e) Heatmap analyses showing miRNA expression profiles for the offspring without and with ASD. (f) Gene ontology (GO) enrichment analysis was performed for affected miRNAs from the offspring with ASD. (g) The top miRNAs that were up-regulated (top) and down-regulated (bottom) were validated by qPCR; expression levels of miRNA in the offspring with ASD (black bars) compared with levels in the offspring without ASD (open bars). NA, the offspring without ASD; A, the offspring with ASD. The data points above the red dashed line represent P values less than 0.05. Euclidean distance was used to generate the heatmap plots.

