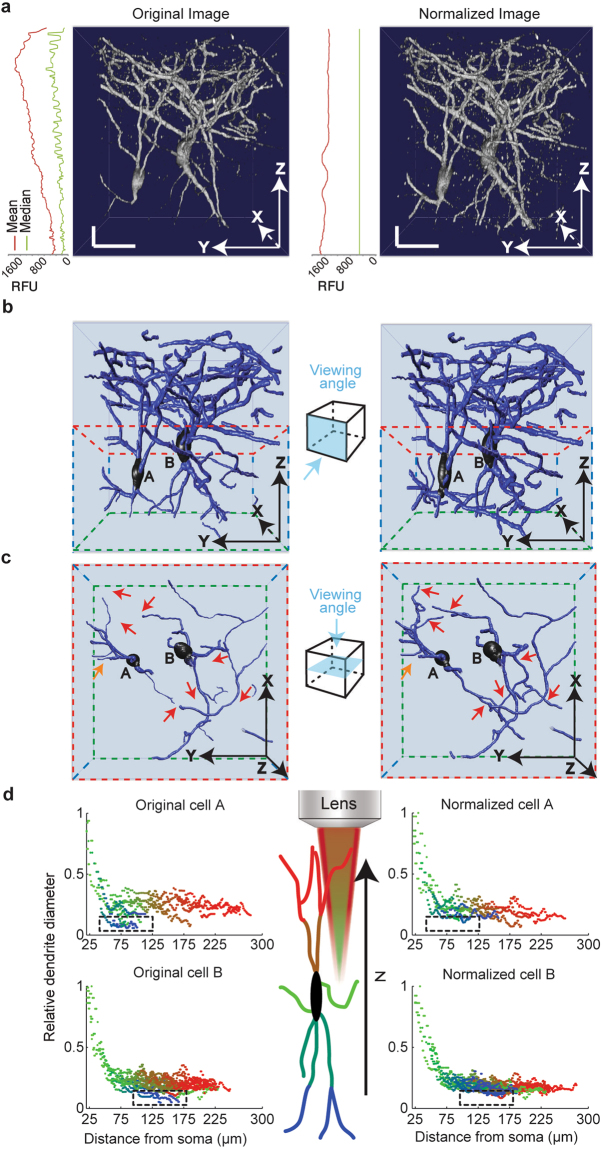
Figure 2.
Intensify3D normalization of 2-Photon imaging data corrects and facilitates the reconstruction of CChIs (a). Orthogonal projections of 3D rendered image stacks before (left) and after (right) normalization. Images are shown together with mean (red) and median (green) relative fluorescent units values across all imaging planes. Note the homogeneous average and median intensity levels post-normalization. Horizontal and vertical scale bars represent 25 µm. For presentation purposes, the z dimension is smaller than x and y dimensions (b). Semi-automated reconstructions of the 2 CChIs (A and B) image stacks above, before and after normalization. Side boxes present the directions of view (c). Top view of the deeper portion (red and green frame) of reconstructed CChIs. Red arrows mark deep dendrites that were detected in the normalized, but not the pre-normalized reconstruction; orange arrow represents the reciprocal dendrites (d). Comparison of the diameter of deep to superficial (blue to red gradient represents Z depth) neurites as a function of distance from the soma. This analysis is based on the reconstructions of both CChIs. Notice that pre-normalization deep dendrites (black rectangles) seem smaller in diameter compared to superficial ones of similar somatic distance. In comparison, post-normalization dendrites show similar diameters to superficial dendrites of similar somatic distance. Illustration of lens and red excitation light illustrates the direction of illumination and decay of light as a function of depth.

