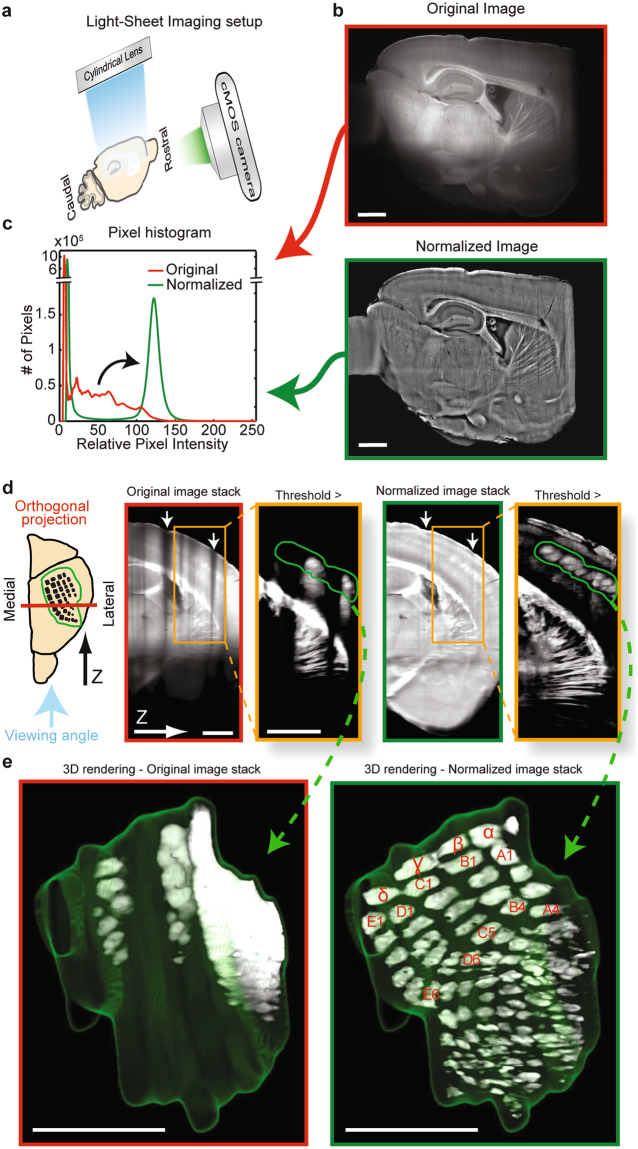
Figure 3.
Auto-fluorescence Light-Sheet image normalization reinforces the iDISCO 3D detection of barrel fields (a). Imaging setup of cleared brain samples with a LS microscope. The LS blue excitation illumination plane is perpendicular to the filtered CMOS camera (b). A single representative sagittal scan. Shown is the blue/green excitation emission spectrum of cleared mouse hemisphere samples before (red frame) and after normalization (green frame) (c). Relative (matched minimum/maximum values) pixel intensity histograms of images before and after correction. Note the post-normalization shift of pixels (black curved arrow) that corresponds to tissue and not to background pixels (d). Pre- and post-normalized image stacks perpendicular to imaging plane, see orientation illustration. Pre-normalization image stack shows decreased intensity due to grooves in the tissue surface (white arrows) as well as along the path of illumination (down). Orange rectangle region emphasizes the barrel cortex region. After applying a threshold (pixels below threshold removed), a 3D region around the barrels was selected (green region) for 3D rendering (FIJI) (e). 3D rendering of barrel fields before and after image normalization. Annotation for barrels marked in red, the green mesh labels the region of interest. Scale bars are 1 mm.

