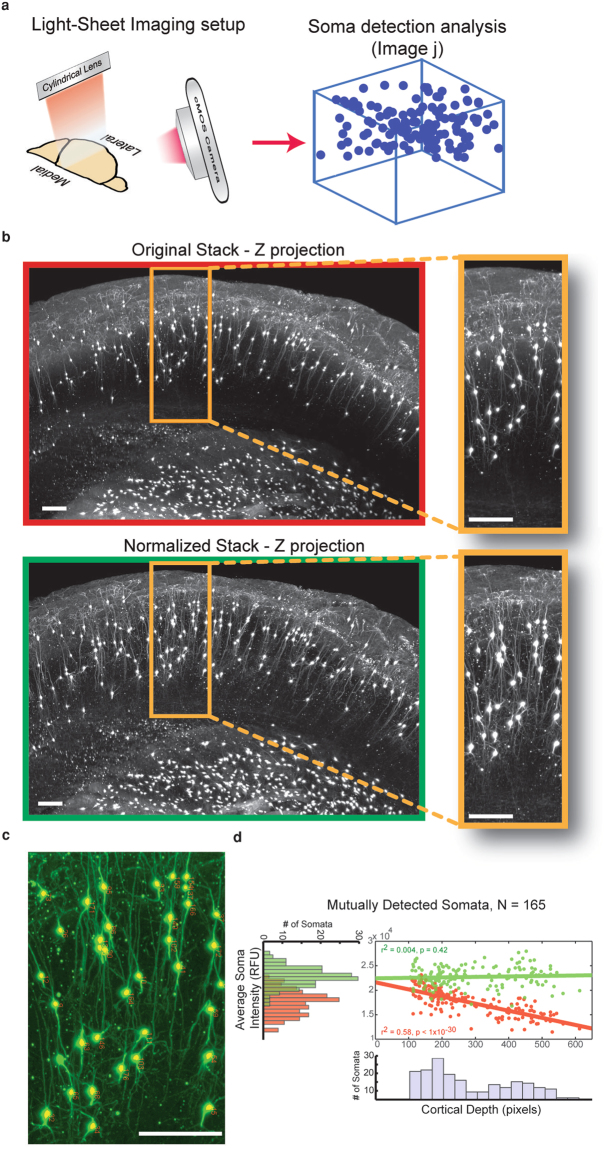
Figure 4.
Intensify3D enables accurate detection and quantification of CChIs in deep cortical layers (a). Imaging setup of LS microscope. A z stack 1mm deep was acquired by far red excitation/emission LS scan of a iDISCO full cortical perpetration (b). Z projection of 250 images showing the CChIs as well as striatal cholinergic interneurons. Orange frame highlights the CChIs. Note the decay in background fluorescence with tissue depth in original image stack enhanced visibility and homogeneity of deep dendrites of CChIs in corrected image stack (green frame) (c). Representative enlarged region overlaid by results of soma detection analysis (yellow dots and red numbers) (d). Soma detection analysis (Fiji, See Methods). Mutually detected somata (from original and corrected image stacks) show a decrease in intensity (Pearson correlation R = −0.76, P < 1 × 10⁻³⁰) and a wide distribution (red histogram). The somata intensity in corrected image stacks shows no correlation with cortical depth ((Pearson correlation R = 0.063, P = 0.42) and a narrower distribution (green histogram). All scale bars are 50 µm.

