Figure 2.
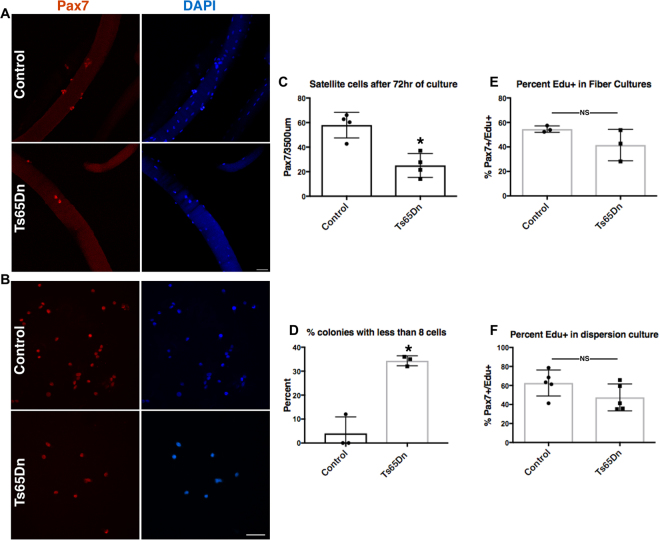
Impaired expansion of Ts65Dn satellite cells in vitro. (A) Pax7+ cells (red) on isolated EDL myofibers after 72 h of culture. Blue is DAPI. (B) Images of satellite cell colonies after 72 h of culture, immunoreactive for Pax7 (red) and DAPI (blue). (C) Quantification of satellite cell number normalized to myofiber length on myofibers cultured for 72 h (n = 4). (D) Quantification of colony size represented as percent of colonies with less than 8 cells after 72 h of culture (n = 3). (E) Quantification of EdU+ satellite cells on 72 h myofiber cultures where EdU was added to media 2 h prior to collection (n = 3). (F) Quantification of EdU+ cells in dispersion cultures after 72 h of culture and EdU given 2 h prior to collection (n = 5). Statistical significance was tested using Student’s t test. Asterisks indicates significant difference and P-value < 0.05. NS indicates not significant. Scale bars are 40 μm.

