Figure 5.
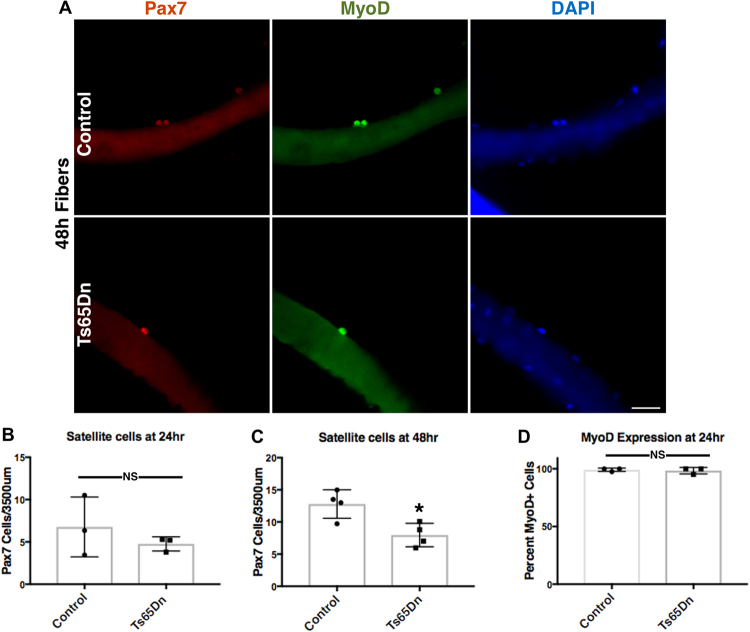
Ts65Dn satellite cells have an impaired first division following exit from quiescence. (A) Images of isolated myofibers grown in culture for 48 h and visualized for Pax7 immunoreactivity (red) and MyoD immunoreactivity (green). Blue is DAPI. Wild type satellite cells are seen as neighbor doublets while Ts65Dn satellite cells are predominately individual cells. (B) Quantification of satellite cell number normalized to myofiber length after 24 h for Ts65Dn myofibers and wild type myofibers (n = 3). (C) Quantification after 48 h of culture for shows a satellites cell on Ts65Dn myofibers compared to wild type myofibers (n = 4). (D) Quantification of MyoD positive satellite cells on myofibers cultured for 24 h from Ts65Dn mice and wild type mice (n = 3). Statistical significance was tested using Student’s t test. Asterisks indicates significant difference and P-value < 0.05. NS indicates not significant. Scale bar is 40 μm.

