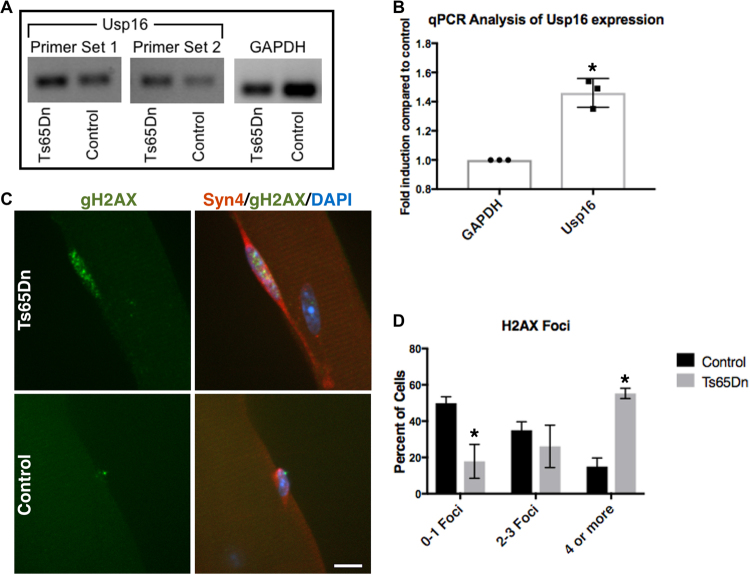
Figure 6.
Increased Usp16 expression and DNA damage in Ts65Dn satellite cells. (A) Semi-quantitative RT-PCR analysis for Usp16 amplification products from cDNA of Ts65Dn satellite cells compared to wild type satellite cells. The images shown were cropped to save space (full-length gel included in Supplementary Information). (B) Quantitative real-time PCR for Usp16 expression in Ts65Dn satellite cells compared to wild type satellite cells (n = 3). (C) Images for isolated myofibers cultured for 24 h immunoreactive for γH2AX (green, DNA damage) and immunoreactive for Syndecan-4 (red, satellite cells). Blue is DAPI. (D) Quantification of DNA damage foci identified by γH2AX labeling in Ts65Dn satellite cells and wild type satellite cells (n = 3). Statistical significance was tested using Student’s t test. Asterisks indicates significant difference and P-value < 0.05. Scale bar is 10 μm.

