Figure 6.
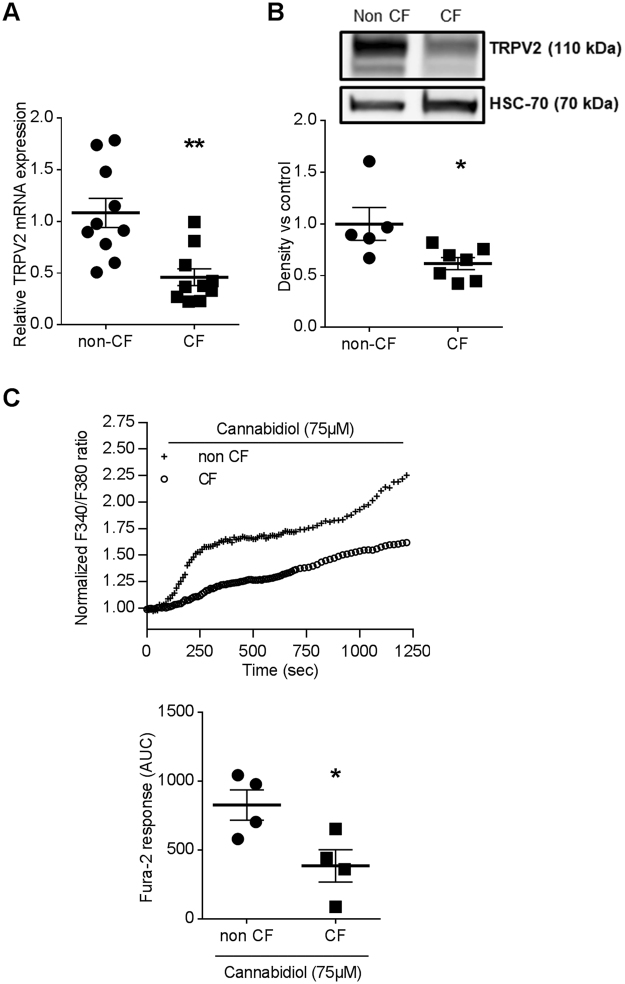
Defective TRPV2 expression and activity in human CF macrophages. (A) TRPV2 gene expression in non-CF (n = 10) and CF macrophages (n = 10, patients 1–10, supplementary Table S1). TRPV2 mRNA expression were determined by RT-qPCR. Mann-Whitney test: **p < 0.01 vs. non-CF macrophages. (B) In a representative blot, TRPV2 (110 kDa) expression is observed on total cellular lysate from non-CF (n = 5) and CF (n = 8, patients 11–18, supplementary Table S1) macrophages. Equal protein loading was controlled via HSC70 detection. Full-length blots are presented in Supplementary Figure 4. The scatter dot plot represents densitometric analysis. Results are shown as the mean ± s.e.m. Mann-Whitney test: *p < 0.05 vs. non-CF macrophages. (C) Fura-2 AM calcium measurement in non-CF and CF macrophages stimulated by cannabidiol (75 µM) (n = 4, patients 19–22, supplementary Table S1). Data are presented as the ratio of emission after excitation at 340 nm relative to that after excitation at 380 nm (F340/F380), and normalized to basal level 1 and to maximal level 4 (ionomycin). Horizontal bar represented stimulus period. Below, area under the curve of similar experiments are shown as mean ± s.e.m. Mann-Whitney test: *p < 0.05 vs. non-CF macrophages.

