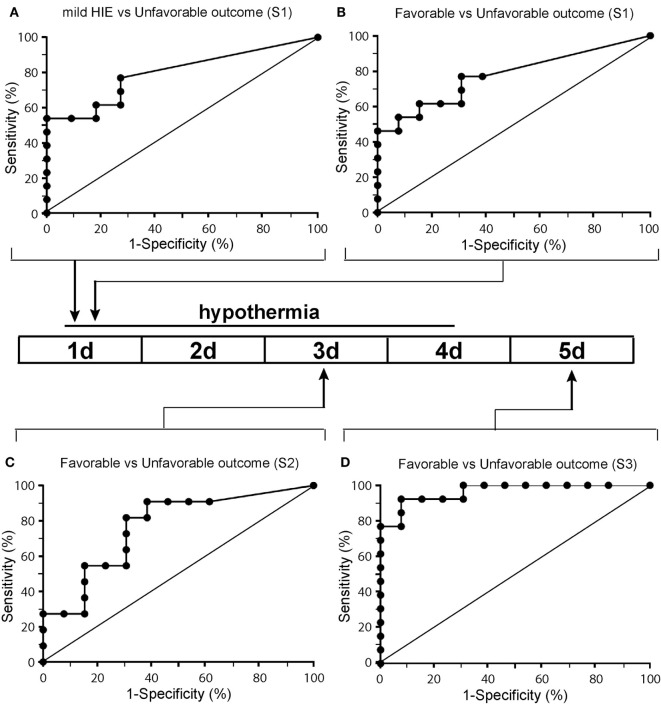
Figure 4.
Receiver operated characteristics curves of the neurofilament light (NfL) biomarker in the plasma of newborns with panel (A) representing a comparison of NfL level for babies with mild hypoxic-ischemic encephalopathy (HIE) [no therapeutic hypothermia (TH)] with TH babies with unfavorable outcome for the first sample and panels (B–D) representing a comparison of babies who had undergone TH at samples 1 (B), sample 2 (C), and sample 3 (D).

