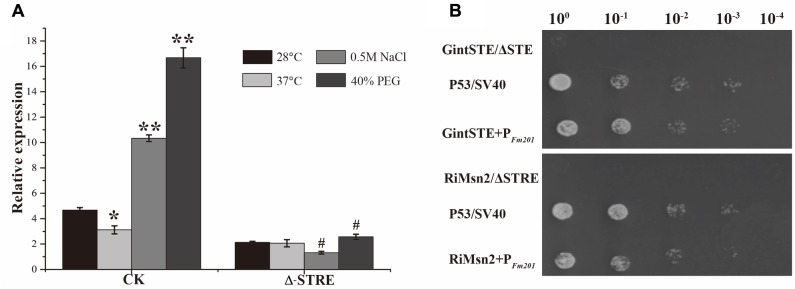
FIGURE 3.
Promoter activity analysis of Fm201 gene in Yeast. (A) Real-time RT-PCR quantification of Fm201 gene expression in yeast under different abiotic stress treatments. CK indicates the full-length promoter sequence of Fm201 gene. Lines with a significant ratio to the express rate of each group in 28°C. Error bars indicate the means of three biological replicates with SD values. Data shown are averages ± SD; n = 3. (#, ∗p < 0.05, ∗∗p < 0.01). (B) Yeast one-hybrid analysis of the interaction between GintSTE or RiMsn2 with Fm201 promoter (pFm201). Yeast carrying both pGBKT7-P53 and pGADT7-SV40 was used as the positive control. pHis2- ΔSTRE with pGADT7-Rec2-RiMsn2 and pHis2- ΔSTE with pGADT7-Rec2-GintSTE were used as negative controls. Δ-STRE indicates the deletion of STRE elements located in pFm201 promoter, Δ-STE indicates the deletion of GintSTE binding sites located in pFm201 promoter. 10-fold serial dilutions of yeast cells were spotted on plates containing 2% Glc as carbon source.

