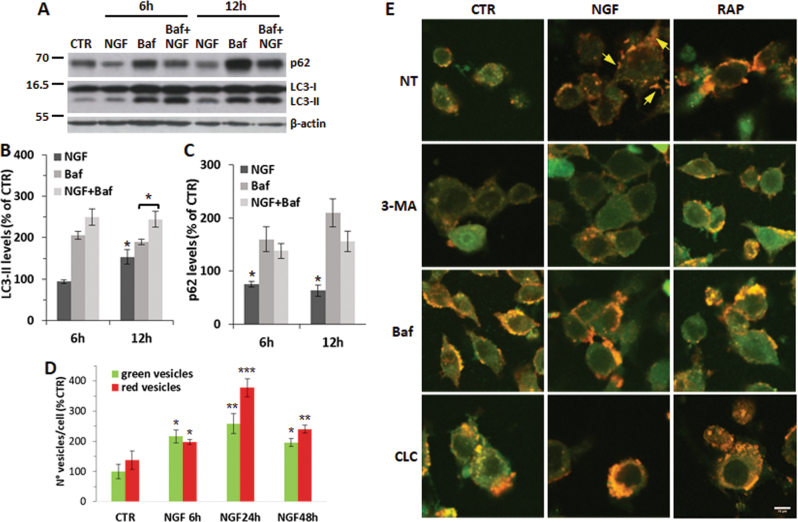
Fig. 2. Analysis of the autophagic flux in NGF-treated PC12 cells.
a Representative immunoblots for LC3-II and p62 content in PC12-615 cells treated for 6 or 12 h with NGF (10 ng/ml) alone or in combination with Baf (100 nM). Values are normalized by the β-actin content. b–c Densitometric analysis of LC3-II (b) and p62 (c) normalized by β-actin. Data are the mean ± SEM of three independent experiments in duplicate. ∗p ≤ 0.05 vs. CTR or Baf (t-test). d Quantitation of green and red vesicles in GFP-RFP-LC3-transfected cells by ImageJ software. Data, expressed as percent of CTR, are the mean ± SEM of the number of vesicles/cell (about 100 cells for each condition) in ten random fields from three separate experiments. ∗p ≤ 0.05, ∗∗p ≤ 0.01, ∗∗∗p ≤ 0.001 vs. CTR (t-test). e Representative images of GFP-RFP-LC3 fluorescence in PC12 cells treated for 24 h with NGF (10 ng/ml) or Rap (200 nM) alone or in combination with 3-MA (10 mM), or Baf (100 nM) or CLC (1 µM). Scale bar = 10 µm

