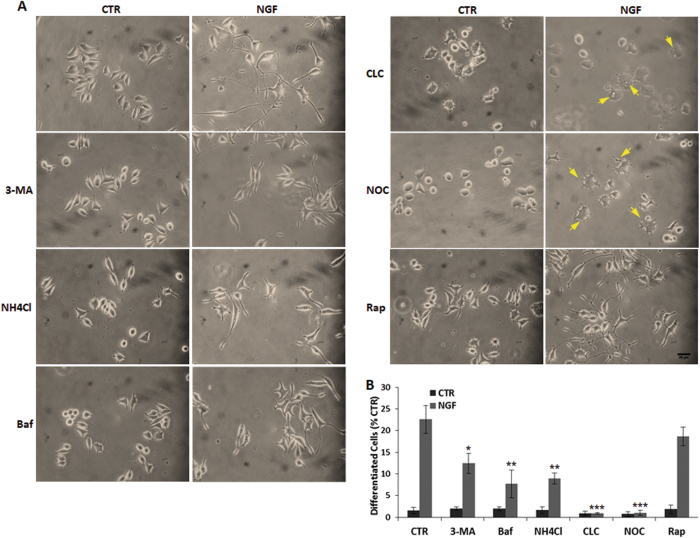
Fig. 4. Pharmacological inhibition of autophagy abolishes NGF-mediated differentiation.
a Representative images of PC12-615 cells following treatment for 24 h with NGF (10 ng/ml) alone or in combination with 3-MA (10 mM), or Baf (100 nM), or NH4Cl (12.5 mM), or CLC (1 µM), or NOC (1 µM), or Rap (200 nM). b Quantitation of NGF-induced differentiation in PC12-615 cells treated for 24 h with NGF alone or in combination with the autophagy blockers. Data, expressed as percent of differentiated cells in ten random fields, are the mean ± SEM of three separate experiments. ∗p ≤ 0.05, ∗∗p ≤ 0.01, ∗∗∗p ≤ 0.001 vs. NGF (ANOVA and Dunnett’s multiple comparisons test). Scale bar = 25 µm

