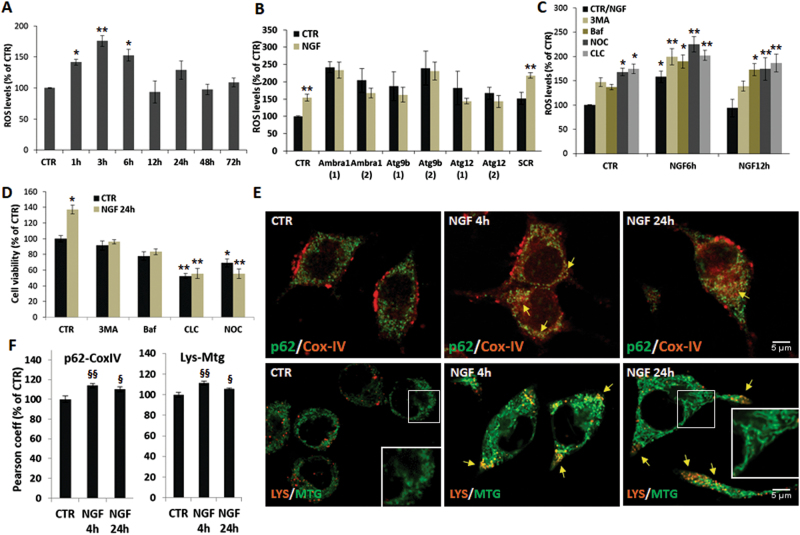
Fig. 5. NGF-mediated increase of ROS underlies the induction of mitophagy.
a Time-course of ROS levels in PC12-615 cells treated with NGF (10 ng/ml) for the indicated times. b Effect of Ambra-1, Atg9b, or Atg12 siRNA on ROS production after exposure to NGF for 6 h. c Effect of autophagy inhibitors on ROS content following NGF treatment for 6 or 12 h. Data in a, b, c, expressed as percent of CTR, are the mean ± SEM of three independent experiments with duplicate samples. d Effect of autophagy inhibitors on cell viability after NGF treatment for 24 h. Data, expressed as percent of CTR, are the mean ± SEM of two separate experiments, each with five samples. e Representative images of PC12-615 cells treated with NGF (10 ng/ml) for 4–24 h, followed by immunostaining for p62 (green)/CoxIV (red) or addition of LYS and MTG during the last 30 min of incubation. Scale bar = 5 µm. f Co-localization of p62/CoxIV or LYS/MTG measured by Pearson coefficient of correlation in about 100 cells for each condition in ten random fields. Data are the mean ± SEM of three independent experiments in duplicate. *p ≤ 0.05, **p ≤ 0.01 vs. their respective CTR (ANOVA and Dunnett’s multiple comparisons test); §p ≤ 0.05, §§p ≤ 0.01 vs. CTR (t-test)

