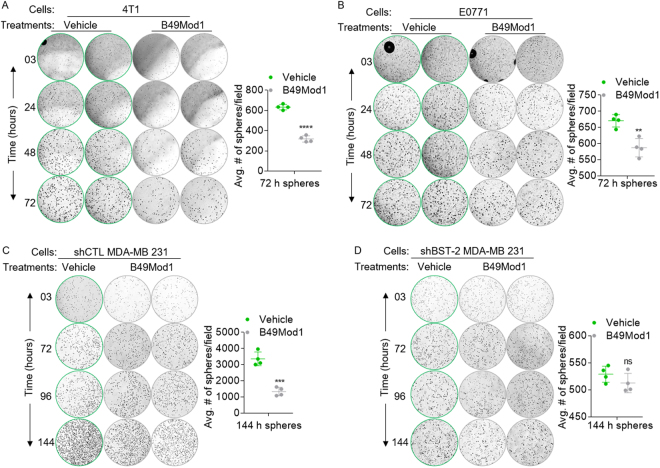
Figure 6.
Time-dependent effect of B49Mod1 on cancer cell expansion in clonogenic 3D cultures. (A,B) Representative 4× images and quantification of spheres formed by (A) 4T1 cells, (B) E0771, (C) shCTL MDA-MB 231 and (D) shBST-2 MDA-MB 231 cells embedded in VitroGel 3D and treated with Vehicle or B49Mod1 (500 ng/well). Graphs show average number of spheres per field. Error bars correspond to SEM for sphere quantification. Significance was taken at **P < 0.01, ***P < 0.001 and ****P < 0.0001. ns = not significant.

