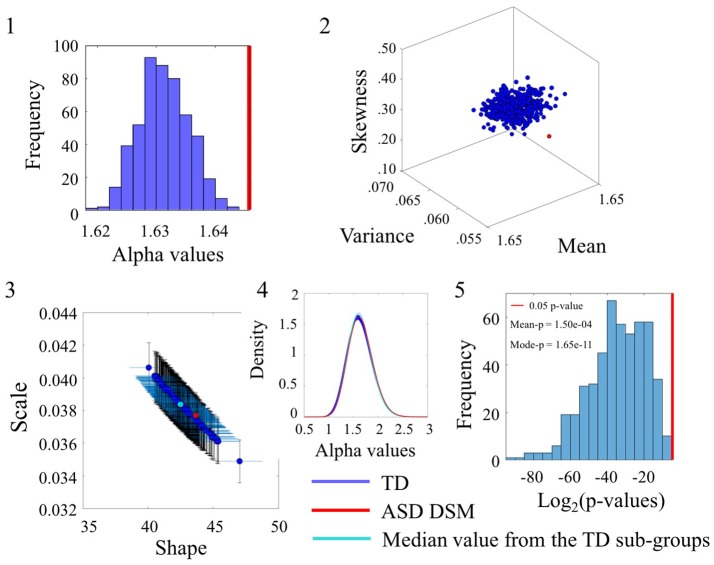
Figure 4.
Comparison of the α values between TD and ASDDSM groups for the Angular Speed (SR0 groups). (1) Distribution of the mean of the alpha values for the 500 sub-groups extracted from original TD group with similar size and age composition as the ASDDSM group. The red vertical line represents the mean of the alpha values of the ASDDSM group. (2) Estimated Gamma moments (red dot for the small group, blue cluster of 500 dots from the bootstrapping with 456 age-matched participants in each sub-group and the cyan dot for the median of those sub-groups). (3) Estimated shape and scale Gamma values with confidence intervals on the Gamma parameter plane. (4) Estimated PDFs. (5) Distribution of p-values (log2 scale for better visualization) with the red line as the reference 0.05 significance-level value. The mean and mode of the p-value distribution is also provided.

