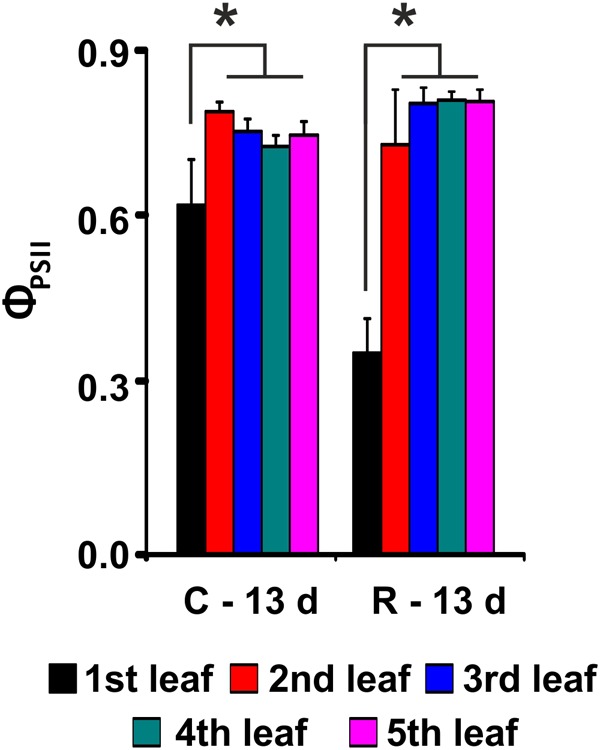
FIGURE 4.

PSII maximum quantum yield (ΦPSII) evaluation after recovery from salt stress for Baldo plants. C – plants not exposed to salt treatment; R – plants in recovery medium. Data are expressed as an average of 6 biological replicates ± SD. Asterisks indicate statistical significance for all the visible differences (p-value < 0.05).
