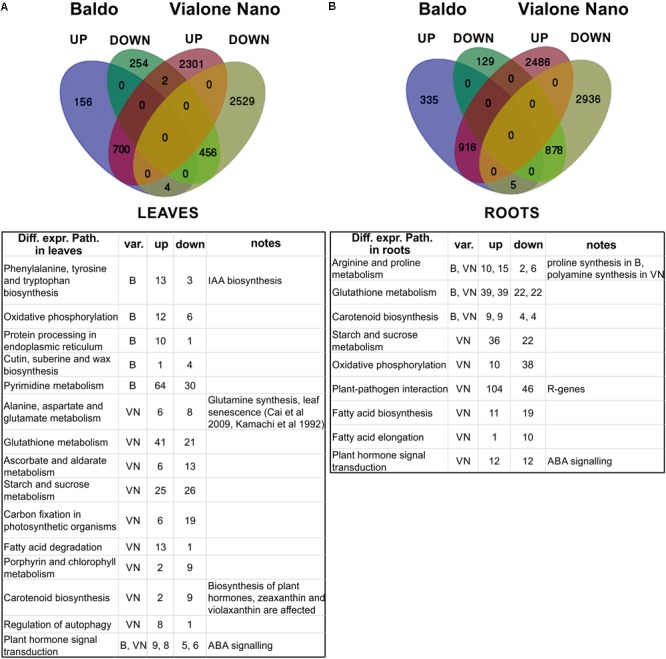
FIGURE 5.

Transcriptomic analysis of leaves and roots after 3 days of salt stress. (A,B) Venn diagrams of up- (UP) and down (DOWN)-regulated genes (upper part). Tables (lower part) report the main differentially expressed pathways resulting from pathway enrichment analysis reported in Supplementary Tables S10, S11. B, Baldo; VN, Vialone Nano; var., variety.
