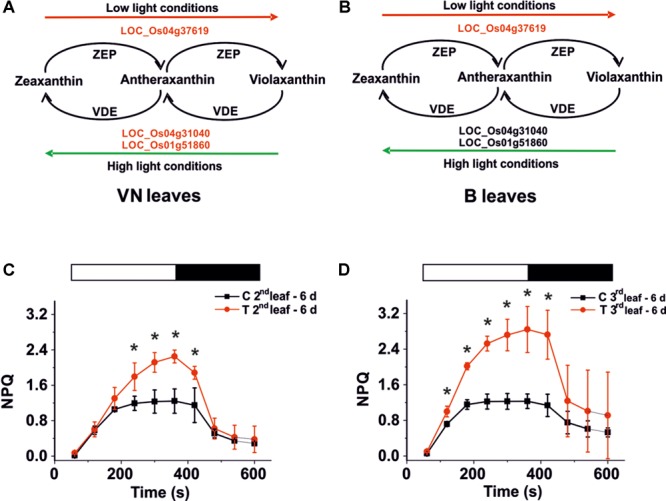
FIGURE 7.

Xanthophyll cycle and NPQ analysis. Genes involved in this cycle are down-regulated (red script) in VN (A) but not in B (B) plants. (C,D) NPQ activation kinetics for Baldo plants exposed to salt stress. NPQ kinetics for the second (C) and third (D) leaf after 6 days of salt treatment. White bars – light induction, black bars – dark relaxation. In red, salt treated plants – T; in black, control plants – C. Data are expressed as an average of six biological replicates ± SD; Asterisks indicate statistical significance for all the visible differences (p-value < 0.05).
