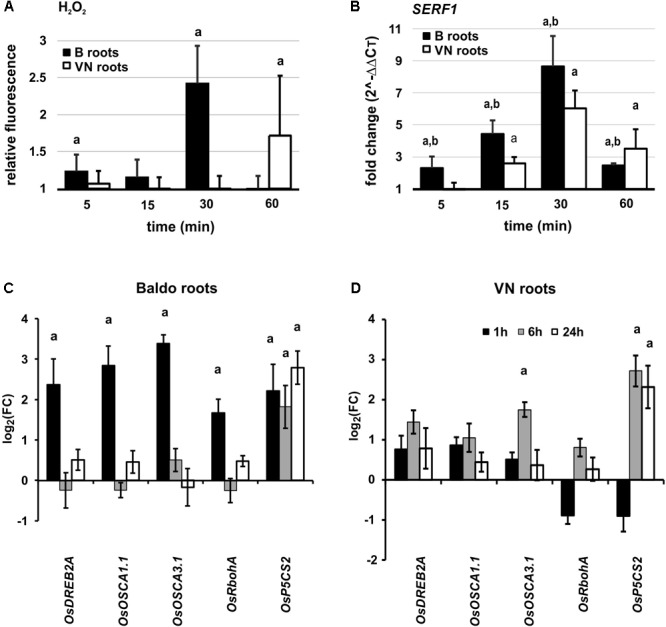
FIGURE 8.

Early responses in plant roots. (A) Overview of H2O2 production in roots of plants exposed to salt stress. Values are calculated with respect to the control at each time-point. Data are mean ± SD of 10 biological replicates and three technical replicates. (B) SERF1 expression profile at different time-points in roots. (C,D) Expression profile of genes involved in perception, signaling and response to salt stress in Baldo (C) and Vialone Nano (D) roots. Data are expressed as mean ± SD of three biological replicates and nine technical replicates. Letters represent p-value < 0.01 with respect to the control (a) or to the other variety (b).
