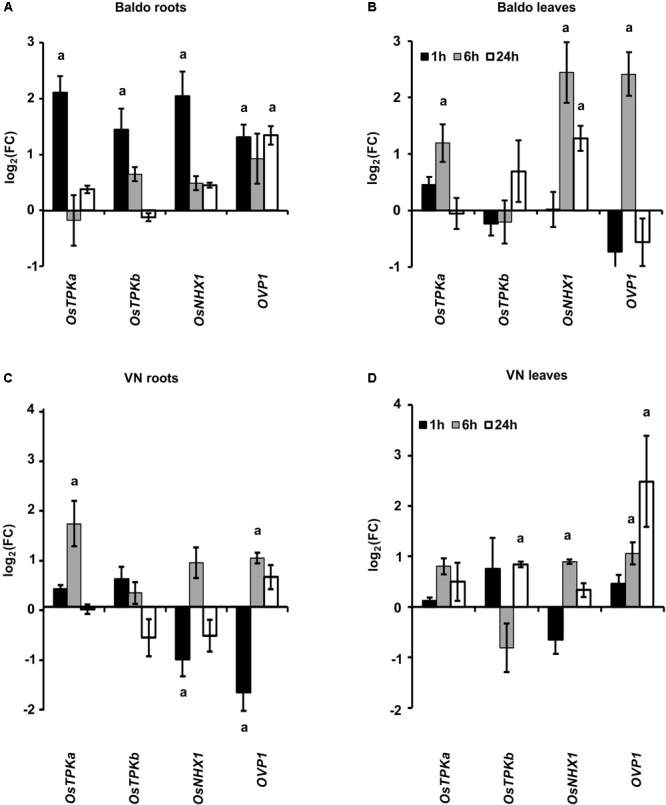
FIGURE 9.

Expression profile of genes involved in K+ release from the vacuole (TPKa and b) and in Na+ compartmentalization (NHX1, OVP1). (A,B) Expression profiles in B plant roots (A) and leaves (B). (C,D) Expression profiles in Vialone Nano plant roots (C) and leaves (D). Data are expressed as mean ± SD of three biological replicates and nine technical replicates. (a, p-value < 0.01 with respect to the control).
