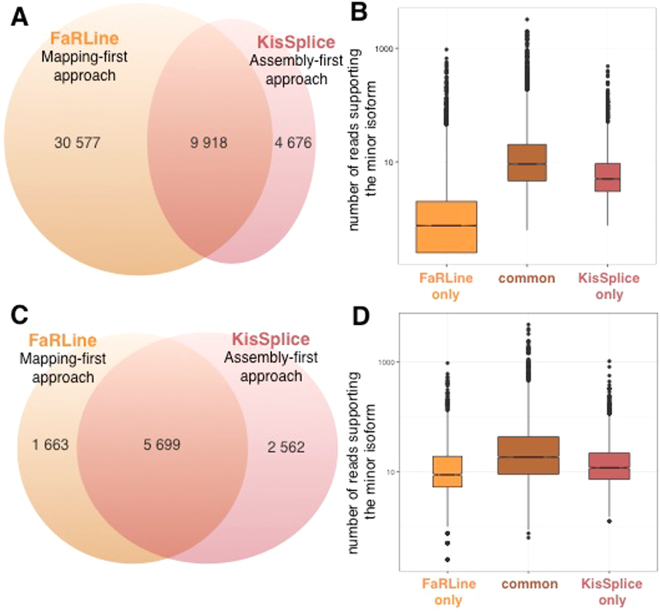
Figure 2.
Comparison of the ASE identified by the assembly-first and mapping-first pipelines. (A) Venn diagram of ASEs identified by the two pipelines. FaRLine detected many more events than KisSplice. 68% of ASE found by KisSplice were also found by FaRLine and 24% of ASE detected by FaRLine were also found by KisSplice. (B) Boxplot of the expression of the minor isoform in the 3 categories defined in the Venn diagram of panel A: ASE identified only by FaRLine, ASE identified by both pipelines and ASE identified only by KisSplice. The number of reads supporting the minor isoform of the ASE identified by FaRLine is overall much lower. Many isoforms are supported by less than 5 reads. (C) Venn diagram of ASEs identified by the two pipelines after filtering out the poorly expressed isoforms (less than 5 reads, or less than 10% of the number of reads supporting both isoforms). The common events represent a larger proportion than before filtering: 77% of the ASE identified by FaRLine and 69% of the ASE identified by KisSplice. (D) Boxplot of the expression of the minor isoform in the 3 categories defined in the Venn diagram of panel C: ASE identified only by FaRLine, ASE identified by both pipelines and ASE identified only by KisSplice. The distribution of the number of reads supporting the minor isoform is similar for the 3 categories with highly expressed variants in each category.

