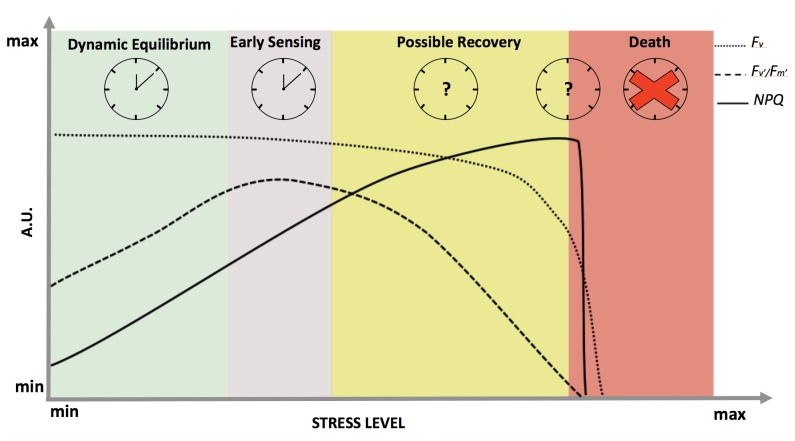
FIGURE 2.
Dynamics of chlorophyll a fluorescence and derived parameters in response to abiotic stress in optimal light conditions. On the x-axis, the stress level is reported as a continuum between a minimum value at physiological equilibrium (green shadow), passing through early sensing (purple shadow) and possible recovery (yellow shadow), till death (red shadow). The y-axis represents fluorescence in arbitrary units: dotted, dashed and solid lines representing Fv (variable fluorescence signal), Fv′/Fm′ (maximum efficiency of photosystem II in light) and NPQ (Non-Photochemical Quenching), respectively. On the top part of the panel, working clocks are reported for the most studied physiological states while clock with the question marks represent the states where clock behavior is completely unknown. The red cross signifies the complete disruption of the clock when plants die.

