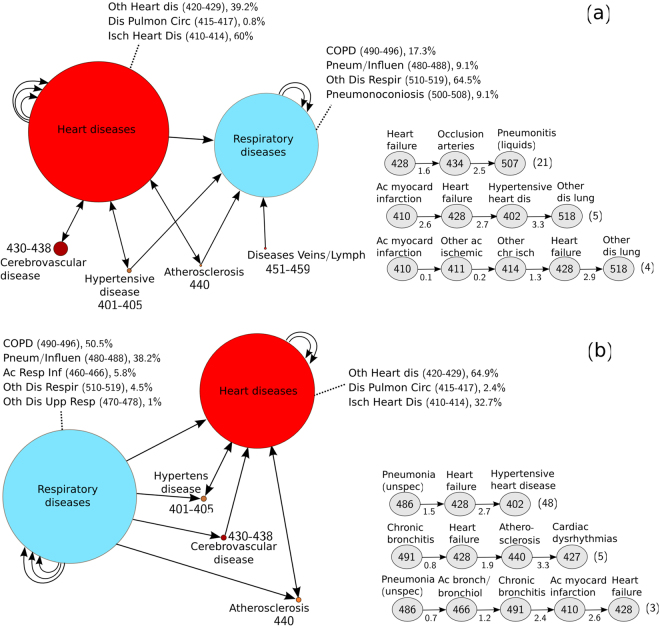
Figure 1.
Schematic representation of two highly populated clusters (respiratory/circulatory). The (a) fifth and (b) fourth most populated clusters extracted for the male sub-population, associated with Table 3 (and Supplementary Table 4). The description of diseases is provided in each node. The nodes are drawn at a size relative to the frequency of appearance of the disease or group of diseases (a minimum node size corresponding to a frequency of 5% has been arbitrarily considered). Shorter and longer trajectories formed by connected nodes are contained in each cluster. Cyclic arrows indicate additional distinct diagnoses belonging to the same group of diseases (repetitions of the same disease are not permitted in a single trajectory). Examples of disease trajectories contained in each cluster are also provided on the bottom-right of the figure panels, together with the corresponding average times (indicated in years below each arrow) and average number of patients involved (shown at the end of each trajectory in parenthesis).

