
Figure 5.
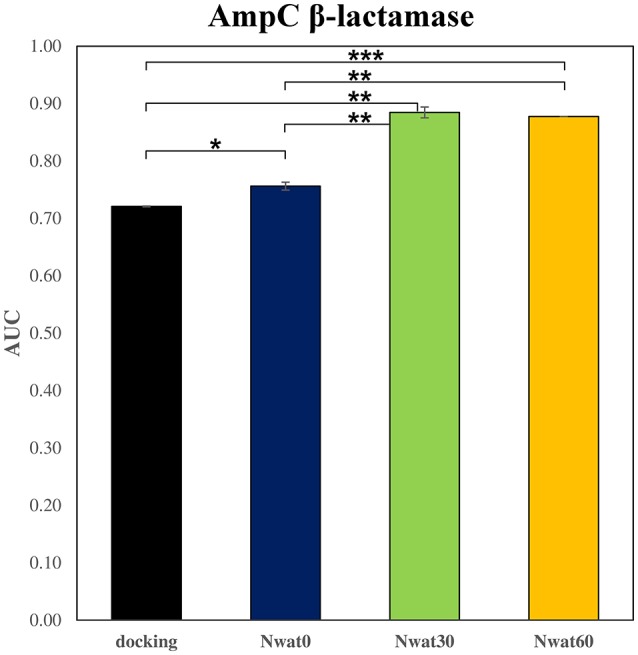
Average ROC AUC values for AmpC β-lactamase. Statistical significance was calculated by t-test and is graphically reported only when a significant variation was observed (*P < 0.05; **P < 0.01; ***P < 0.001).
Official websites use .gov
A
.gov website belongs to an official
government organization in the United States.
Secure .gov websites use HTTPS
A lock (
) or https:// means you've safely
connected to the .gov website. Share sensitive
information only on official, secure websites.
Average ROC AUC values for AmpC β-lactamase. Statistical significance was calculated by t-test and is graphically reported only when a significant variation was observed (*P < 0.05; **P < 0.01; ***P < 0.001).