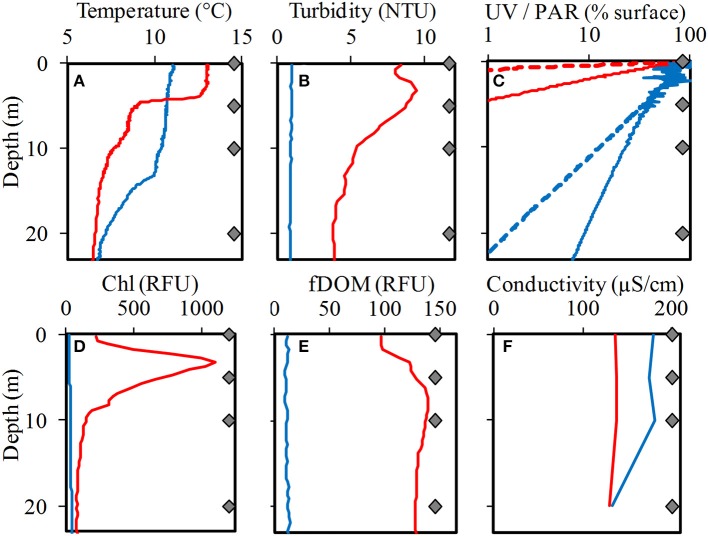
Figure 3.
Profiles of temperature (A), turbidity (B), light (UV and PAR) (C), chlorophyll-a fluorescence (D), fluorescent dissolved organic matter (fDOM) (E), and conductivity (F) in Laguna Negra (blue lines) and Lo Encañado (red lines). For (C), UV profiles are dashed, and PAR profiles are solid lines. NTU is nephelometric turbidity units and RFU is relative fluorescent units. The four gray diamonds on each graph represent the sampling depths.

