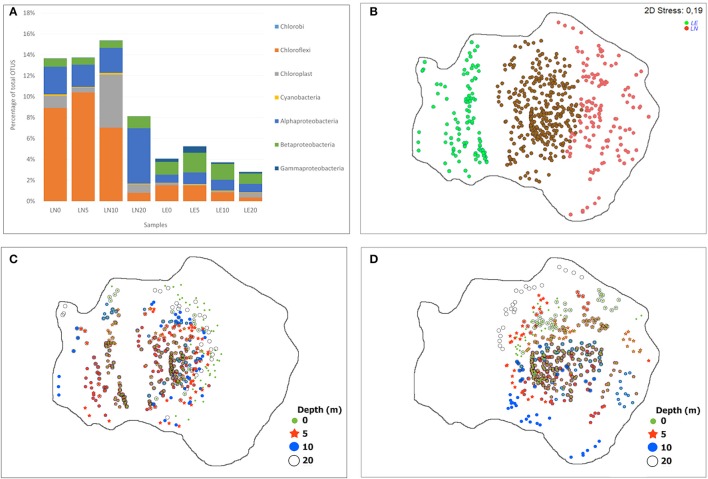
Figure 7.
Distribution of the phototrophic phylotypes (OTUs), (A) by percentage of each phylum relative to total OTUs, (B–D) NMDS showing OTUs distribution between the samples, (B) common (brown) and exclusive phylotypes of both lakes (red LN and green LE), (C) distribution of the phylotypes present in LE at different depth, (D) distribution of the phylotypes present in LN at different depth.

